Solar Panel Efficiency Calculator

Engineering-grade STC, NOCT and Operating Efficiency Analysis

What This Calculator Measures

A module's efficiency printed on the box — usually 15% to 22% — is only measured once, in a lab, under Standard Test Conditions (STC). Every panel on your roof or in your field spends the rest of its life at a different irradiance and a different temperature, so its real efficiency is constantly moving. This tool lets you compute all three numbers that matter for a real installation: the lab-rated STC efficiency, the operating efficiency at your actual measured conditions, and the temperature-corrected efficiency that lets you compare a module's health fairly, regardless of when you took the measurement.

Use it to sanity-check a manufacturer's efficiency claim, diagnose underperforming strings from SCADA logs, or estimate expected output before commissioning. All calculations run locally in your browser — no module or plant data is uploaded anywhere.

PV Module Input Parameters

Wp
m
m
Calculated Module Area: 2.583

Operating Environment

W
W/m²
°C
Measured temperature directly taped behind PV cells.
°C
Input only if measuring cells directly via thermography.
°C
m/s
%/°C
°C
W/m²
%

Real-Time Efficiency Analysis

Operating Efficiency
0.00%
At current irradiance & temp
0.00%
STC Nameplate Eff
0.00%
Normalized to 25°C
0 W
Expected Output
0.0%
Module Health PR
Thermal Loss/Gain: 0.0%
Enter valid measurements to show diagnostic summary.
PV Module Spec Comparison Table (Up to 10 Panels)
Module Name Rated Wp Area STC Efficiency Operating Efficiency Temp-Corrected (25°C) Thermal Loss
No modules saved for comparison. Go to 'Manual' tab to input parameters, then click 'Save to Comparison'.
Save panels to trigger side-by-side comparative rankings.

Time-Series SCADA Diagnostics

Upload CSV telemetry logs directly from your plant SCADA database. Calculations run purely locally inside the browser memory. No telemetry or customer data is transmitted over the network.

📤

Drag and drop CSV files here, or click to browse

Max 10 distinct panel names, limit 1,000 rows.

Telemetry Statistical Performance Metrics
Panel Name Avg Operating Eff Peak Efficiency Median Efficiency Std Dev (σ) Avg Temperature Loss Calculated Health (PR)
No parsed analysis reports available. Load CSV data via 'SCADA CSV Import' to calculate.
Analytical Method Explanation:
  1. Avg Operating Efficiency excludes solar irradiance below 50 W/m² (nighttime filtering) to avoid division noise.
  2. Standard Deviation (σ) measures operational spread. Higher deviations suggest issues like shading, dirt build-up, or faulty sensor readings.
  3. Health Ratio (PR) shows the ratio between the actual measured output and the expected output under cell temperature corrections. A health ratio below 90% requires attention.

Local PV Telemetry Visualizations

💡 Interactive Chart Controls: Hover points to inspect; scroll/wheel to zoom; drag to pan; double click to reset zoom.

Solar Module Calculation Foundations

Determining the actual operational efficiency of a Photovoltaic (PV) solar panel requires normalizing environmental parameters to match nominal STC datasheets. Raw outputs without temperature and irradiance corrections can lead to inaccurate conclusions about module degradation.

1. STC (Standard Test Conditions) vs. Operating Efficiency

Nominal panel efficiency is tested at Standard Test Conditions (STC): cell temperature of 25°C, solar irradiance of 1000 W/m², and an Air Mass (AM) of 1.5. Real-world operating efficiencies are often lower due to elevated cell temperatures, lower plane-of-array irradiance, soiling, and cabling impedance:

Eta_op = (Measured DC Power / (Area * Effective Irradiance)) * 100

2. Normalizing Efficiency using Cell Temperature Models

Standard temperature coefficients of power are negative (e.g., -0.34%/°C), meaning that for every degree above 25°C, efficiency drops. The NOCT (Nominal Operating Cell Temperature) model calculates cell temperatures based on ambient conditions. The more advanced Faiman Model (used in PVsyst software) accounts for convective cooling from wind speed, providing highly accurate cell temperatures for utility-scale utility tracking arrays:

Tcell = Tamb + Irradiance / (U0 + U1 * WindSpeed)

Frequently Asked Questions

How do I use this calculator for Bifacial PV modules?
Enable the "Bifacial Gain" checkbox in the manual inputs. If you have rear irradiance sensors (albedo monitoring), input the measured rear irradiance value along with the module's bifaciality factor. Alternatively, input the estimated Bifacial Gain percentage directly to calculate the total effective irradiance.
Why does operating efficiency fluctuate wildly at dawn and dusk?
Under low irradiance (< 100 W/m²), shunt resistance losses become significant, and the signal-to-noise ratio of pyranometers/power meters decreases. To avoid these low-light distortions, our SCADA parser automatically filters out data below 50 W/m² during calculations.
Where can I find my module's Temperature Coefficient of Power?
This coefficient is listed on the manufacturer's datasheet under "Temperature Characteristics" as the Temperature Coefficient of Pmax or Pmp. For modern n-type TOPCon panels, it is typically around -0.30%/°C, while p-type PERC panels average -0.34%/°C to -0.37%/°C.
How do I calculate solar panel efficiency from a datasheet?
Divide the rated power (Pmax, in watts) by the module's area in square meters, divide by 1000 W/m² (the STC test irradiance), then multiply by 100. For example, a 400W module measuring 2.009 m × 1.0035 m has an area of about 2.016 m², giving an STC efficiency of roughly 19.84%.
Why is my calculated efficiency different from the number on the datasheet?
A gap under about 0.5% usually comes from rounding in the published dimensions versus the exact frame-to-frame measurement, or the manufacturer using a slightly different area basis for their published percentage. A larger gap usually means the module simply isn't operating at Standard Test Conditions when you took the reading — check irradiance and cell temperature first.
What is NOCT and why does it matter?
NOCT (Nominal Operating Cell Temperature) is the cell temperature a module reaches under 800 W/m² irradiance, 20°C ambient air temperature, and 1 m/s wind — a standardized reference condition close to typical field operation. It's used to estimate real-world cell temperature from ambient conditions when you don't have a direct cell-temperature sensor.
What is the difference between solar module STC efficiency and operating efficiency?
STC (Standard Test Conditions) efficiency is measured in a laboratory under 1000 W/m² irradiance, 25°C cell temperature, and Air Mass 1.5. Operating efficiency is the real-time efficiency calculated from measured field DC power, actual surface irradiance (POA), and actual module surface area.
How to Use This Calculator: Finding Values on Your Datasheet

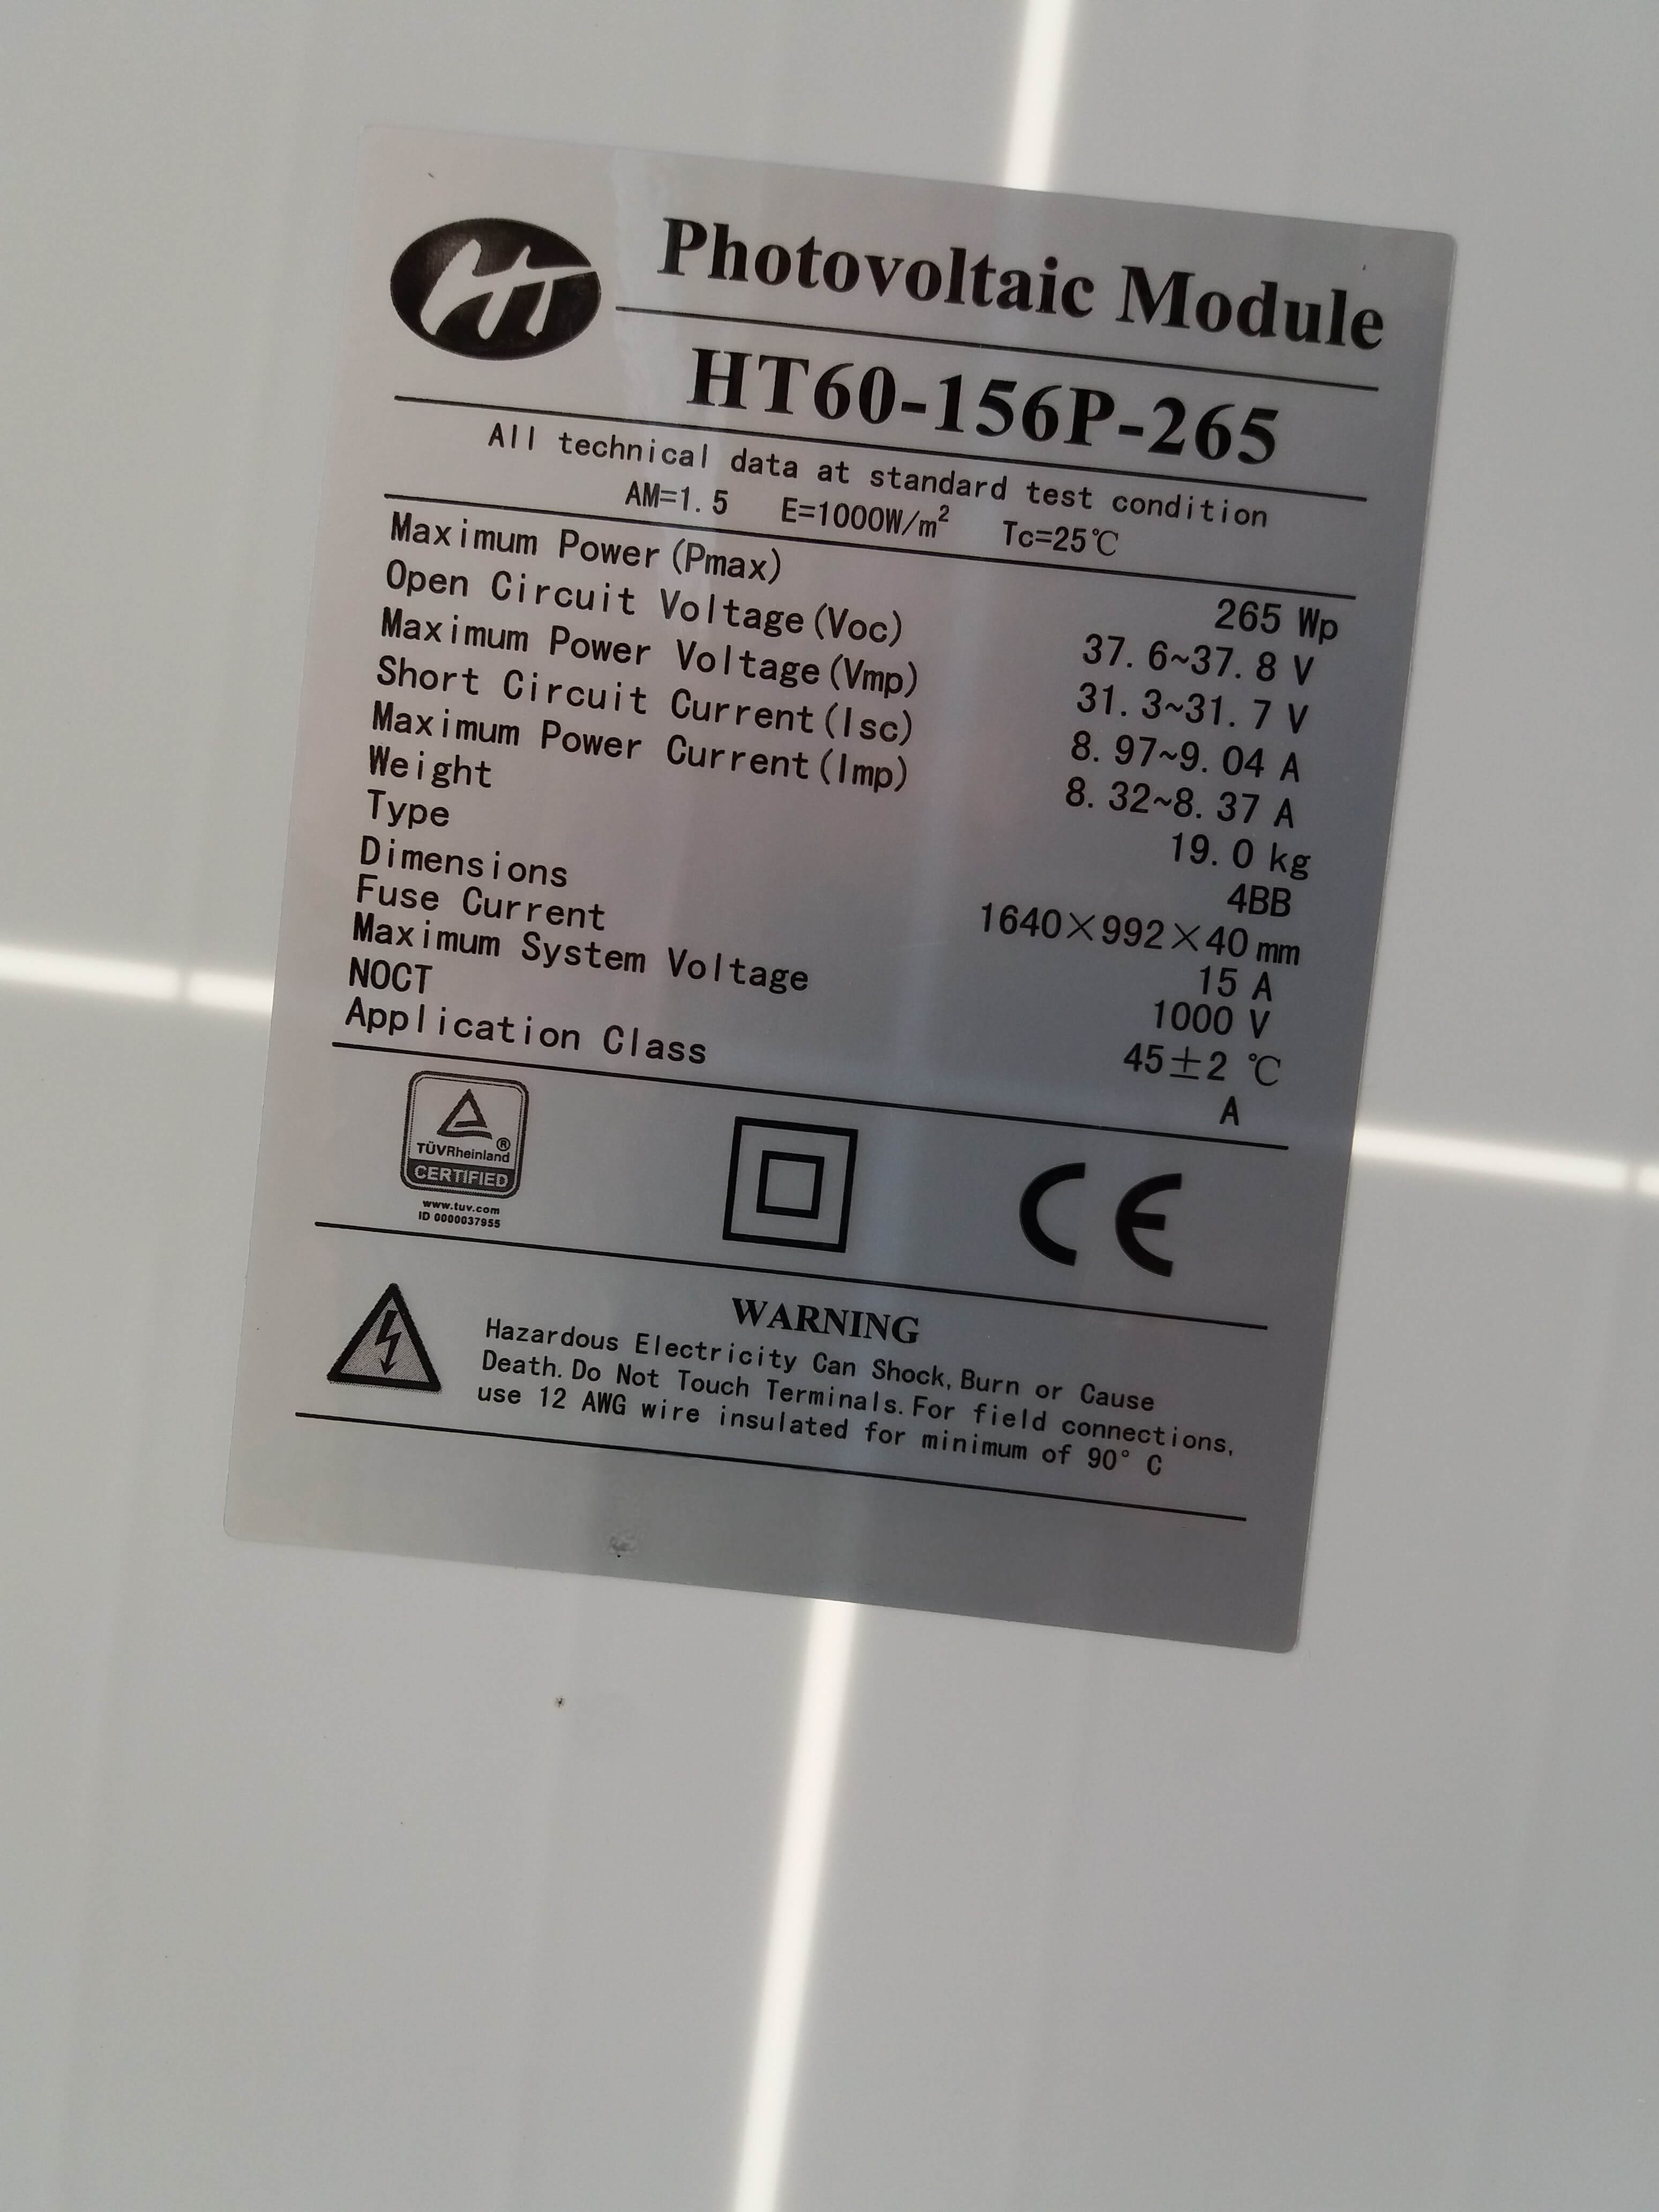
Every value the "Module Identity" section asks for comes directly off the module's rear nameplate label or the manufacturer's PDF datasheet. Here's exactly where to find each one and how to avoid the mistakes that most commonly throw off a calculation.

Example PV module nameplate label showing Maximum Power (Pmax), Voc, Vmp, Isc, Imp, dimensions, and NOCT fields used by this calculator
A typical rear nameplate label. Maximum Power (Pmax), Dimensions, and NOCT come straight from here — the Temperature Coefficient of Power usually does not, and must be found on the full PDF datasheet instead.

Mandatory fields (calculator cannot run without these)

FieldWhere to find itCommon mistake
Nominal Rated Power (Pmp) Listed as "Maximum Power (Pmax)" on the nameplate, in watts (Wp). Confusing it with Voc or Isc — those are voltage/current values, not power.
Module Length / Width Listed as "Dimensions," usually in millimeters (L × W × Thickness). Forgetting to convert mm to meters, or entering the frame thickness as if it were the width.
Measured DC Power Output From a clamp meter, string combiner reading, or SCADA/inverter log — never from the nameplate. Entering the nameplate Pmax instead of an actual field reading — this always produces a false 100% health score.
Plane-of-Array (POA) Irradiance A pyranometer or reference cell mounted at the same tilt/orientation as the module. See our Solar Insolation (POA) calculator if you need to estimate it. Using a weather-station or satellite GHI value instead of actual POA irradiance — these can differ by 10–20%. Read POA irradiance vs. GHI for the distinction.

Optional but recommended fields

FieldWhere to find itNotes
Temperature Coefficient of Power (Pmp) Datasheet section titled "Temperature Characteristics," expressed as %/°C. Not on most nameplate stickers — only on the full PDF datasheet. If unavailable, poly-Si modules typically run −0.40% to −0.45%/°C, mono PERC around −0.34% to −0.38%/°C, and TOPCon/HJT around −0.29% to −0.31%/°C. Treat any assumed value as provisional.
NOCT Datasheet "Thermal Characteristics" section, typically 43°C to 47°C. Also frequently missing from nameplate-only labels — required for the NOCT thermal model if you don't have a direct cell-temperature reading.
Back-of-Module Temp (RTD) / Direct Cell Temp Field measurement only — an RTD taped to the rear of the module, or a thermal camera reading of the cell surface. See cell temperature vs. module temperature for the difference. If you have a direct cell-temperature reading, use the override field — it's more accurate than any ambient-based model.
Wind Speed On-site anemometer or met station. Only used by the Faiman model — leave the NOCT model selected if you don't have reliable wind data.

Step-by-step

  1. Photograph or locate your module's nameplate and, if possible, its full PDF datasheet (nameplates rarely include the temperature coefficient or NOCT).
  2. Enter the Module Identifier, Rated Power, Length, and Width. Leave "Manual Area Override" blank unless you've physically measured the panel and it differs from the nameplate dimensions.
  3. Enter your field measurements: Measured DC Power, POA Irradiance, and either Back-of-Module Temp or a direct Cell Temp reading.
  4. Enter Ambient Temp and, only if using the Faiman model, Wind Speed.
  5. Enter the Temperature Coefficient and NOCT from the full datasheet. If you only have a nameplate photo, use the category-typical values above as a placeholder and flag them as provisional.
  6. Review the Real-Time Efficiency Analysis panel. A Module Health (PR) reading between roughly 90% and 100% is normal; consistently lower readings warrant an inspection for soiling or shading.

Calculator Features

Calculator Limitations

When to Use This Calculator — and When Not To

Good fit: verifying a manufacturer's efficiency claim, a quick field diagnostic during commissioning or O&M rounds, comparing modules from different vendors on a common basis, or spot-checking SCADA logs for underperforming strings.

Not a substitute for: full energy-yield simulation software (PVsyst, SAM, PlantPredict) for financial modeling or bankable yield estimates, IEC 61215/61730 certification testing, or degradation-rate analysis requiring multi-year regression — those require longer time-series datasets and additional loss factors this tool intentionally keeps out of scope for clarity.