DC Cable Losses in Solar PV — How to Calculate Them for Your PR Report
What Are DC Cable Losses in a Solar PV Plant?
Every time current flows through a conductor, some energy converts to heat. In a solar PV plant, the DC section starts at the module terminals and ends at the inverter input. Any energy lost along that path — across string cables, combiner box busbars, connectors, and DC main cables — counts as a DC cable loss.
The underlying physics is straightforward. Power loss in a conductor follows the I²R relationship:
where:
I = current flowing through the cable (Amps)
R = total resistance of the cable run (Ohms)
Source: Sandia National Laboratories / PVPMC — DC Wiring Losses, pvpmc.sandia.gov
The key takeaway from this formula is that power loss scales with the square of current. Double the current, and losses quadruple (assuming constant resistance). This is why cable sizing choices during plant design have a lasting financial impact across the plant's 25-year life.
On a real ground-mounted plant, DC cable losses show up at several points:
- String cables — from module strings to the string combiner or inverter string input
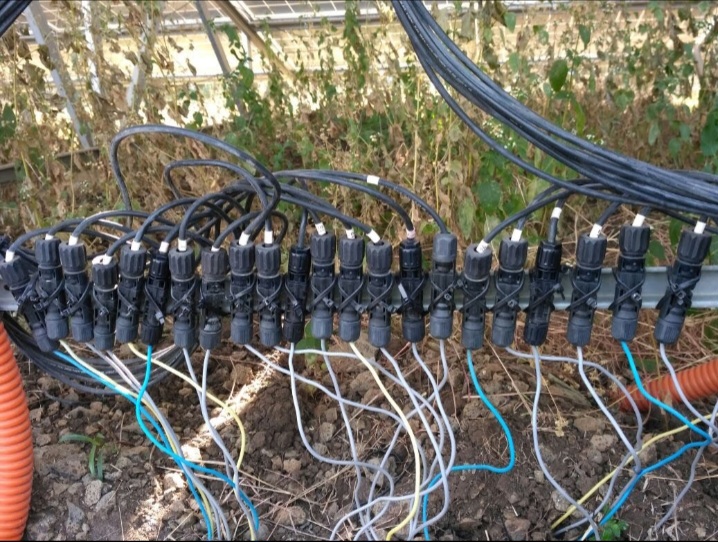
- MC4 and connector junctions — each connector adds a small but measurable resistance drop
- DC combiner busbars — in central inverter plants with combiner boxes
- DC main cables — from combiner box to the inverter DC input terminals
Why DC Cable Losses Belong in Your PR Report
The Performance Ratio is one of the most used metrics for reporting and comparing solar plant performance. As defined in IEC 61724-1, PR compares actual AC energy output with the reference energy yield derived from measured solar irradiance and installed DC capacity.
where:
E_AC = measured AC energy delivered to the grid (kWh)
H_POA = plane-of-array irradiation during the period (kWh/m²)
P_STC = installed DC nameplate capacity at STC (kWp)
Source: IEC 61724-1:2021 standard; PVsyst help documentation (pvsyst.com)
Notice that DC cable losses directly reduce E_AC — the numerator. The irradiance and nameplate capacity in the denominator don't change. In non-clipping conditions, a 1% DC energy loss reduces PR by approximately 1% relative (e.g., PR 0.800 → 0.792). With inverter clipping, the impact may be lower.
On a 5 MWp utility plant producing around 7,500 MWh annually, that 1% loss is roughly 75,000 kWh per year. At typical grid tariff rates, that's real lost revenue — every single year.
PR reports that group cable losses under “miscellaneous losses” make it difficult for O&M teams to identify root causes or track cable degradation over time. Reporting DC cable losses as a separate line item provides traceability.
Use our Capacity Based PR calculator to get your plant's Performance Ratio using measured energy, DC capacity, and plane-of-array insolation. If temperature effects are a major factor on your site, the Temperature Corrected PR calculator gives a more accurate baseline.
New to H_POA and how it differs from GHI? Our guide on POA irradiance vs GHI explains exactly which irradiance input your PR calculation needs.
What Are Typical DC Cable Loss Values on Real Plants?
Before diving into calculation steps, it helps to understand what normal looks like. Below are typical DC cable loss ranges based on published research and industry standards.
| Design Condition | Typical Annual Energy Loss | Key Determinants (Not Just Cable Size) |
|---|---|---|
| Optimized design (1500V, short runs <30m, 10–16 mm², well-planned layout) | 0.20% – 0.40% | Short cable length dominates. Cross-section secondary. |
| Good engineering design (1500V, moderate runs 30–60m, 6–10 mm²) | 0.25% – 0.60% | Length and irradiance-weighted current profile are primary drivers. |
| Acceptable field design (1000V or 1500V, runs 40–80m, 4–6 mm²) | 0.40% – 0.90% | Loss increases with length. 1000V systems have higher current → higher I²R loss. |
| Long runs or congested routing (80–120m, 4 mm², high ambient, bundled trays) | 0.70% – 1.20% | Length dominates. Bundling increases operating temperature → higher resistance. |
| Undersized cables or excessive runs (>120m, 1.5–2.5 mm²) | 1.0% – 1.8% | Engineering concern. Usually violates design guidelines unless cost-driven. |
| Severe connector degradation or poor terminations | Additional 0.3% – 1.5% plant yield reduction | Contact resistance increase (5–50+ mΩ per degraded connector). Not pure I²R addition — includes mismatch and localized heating. Detect via IR thermography. |
Field experience across utility-scale plants shows that cable length is often a more significant factor than cross-section alone. A 4 mm² cable over 20m can have lower loss than a 10 mm² cable over 120m. Always evaluate the complete circuit, not just the cable size.
How to Calculate DC Cable Losses for Your PR Report
There are two practical methods to calculate DC cable losses on an operating plant: the calculation method and the measurement method. Most O&M reporting uses a combination of both.
Method 1: Calculate from Cable Design Data
If you have the plant’s as-built cable layout (string lengths, cable cross-sections, and inverter layout), you can calculate the DC cable loss percentage for any operating condition.
-
1
Get string cable details: Find the total one-way cable length per string and the cable cross-section (mm²) from the as-built drawings or O&M manual.
-
2
Calculate round-trip resistance: Use R = ρ × (2L / A) for 20°C estimates. For field accuracy, apply temperature correction: R = ρ × (1 + α × (T_op - 20)) × (2L / A), where ρ = 0.0178 Ω·mm²/m, α = 0.00393/°C, and T_op = 65-75°C for cables in direct sun.
-
3
Calculate power loss: Apply P_loss = I² × R using the string's rated short-circuit current (I_sc) or operating current (I_mpp) as the design current.
-
4
Express as a percentage: Cable Loss % = (P_loss / P_string) × 100. This is your DC cable loss factor for the PR report.
R = 0.0178 × (2 × 50m / 6mm²) → R ≈ 0.297 Ω
P_loss = I² × R
P_loss = (13A)² × 0.297 → P_loss ≈ 50 W per string
If P_string = 6,500 W (typical modern string):
Cable Loss % = (50 / 6500) × 100 → ≈ 0.77%
Note: This example uses 20°C resistivity. Field cables at 70°C have ~20% higher resistance, increasing loss to ~0.92%. Use temperature-corrected resistance for accurate estimates.
Method 2: Measure Using Plant Monitoring Data
On plants with inverter-level and string-level monitoring, you can compare the measured DC power at the inverter input with the expected PV array output calculated from irradiance and temperature. After accounting for module degradation and mismatch losses, the remaining difference represents cable and connector losses.
The process uses your plant's SCADA or data logger records:
- Export DC power input to the inverter (kWh) and the expected DC array output from your performance model.
- Compare over a representative period — ideally one full month — to average out irradiance and temperature variations.
- The consistent shortfall, expressed as a percentage of modelled DC array output, represents your measured DC cable and connector loss.
Our Plant & Grid Generation Loss calculator lets you enter your plant's monitored data and see each loss component — including DC cable losses — as a percentage of annual output. It follows the IEC 61724-1 loss breakdown structure.
How to Present DC Cable Losses in a Formal PR Report
A well-structured PR report shows losses step by step from irradiance to AC output. DC cable losses are included in DC array losses, between module output and inverter DC input.
Here is how to correctly position and label DC cable losses in a standard loss breakdown:
| Loss Category | Loss Type | Typical Range (Modern Plant) | Section in Report |
|---|---|---|---|
| Irradiance (soiling, IAM, shading) | Optical | 1% – 8% | DC array losses |
| Module temperature | Thermal | 3% – 8% | DC array losses |
| Module mismatch | Electrical | 0.5% – 1.5% | DC array losses |
| DC cable (well-designed, 4-10 mm², optimized layout) | Ohmic | 0.2% – 0.6% | DC array losses |
| DC cable (undersized 1.5-2.5 mm² or degraded) | Ohmic | 1.5% – 2.5% | DC array losses |
| Inverter conversion (utility-scale) | Conversion | 1.5% – 2.5% | System losses |
| AC cable losses | Ohmic | 0.3% – 1.0% | System losses |
When reporting DC cable losses, use consistent terms such as “DC ohmic losses” or “DC wiring losses”. Report values as both percentage of DC energy and annual energy loss (kWh).
In PV performance models such as PVsyst, DC ohmic losses represent resistive losses in DC wiring between modules and the inverter. This is the correct baseline for comparison with measured plant performance.
What Causes High DC Cable Losses on Operating Plants?
Understanding the root causes helps you turn a PR report finding into a corrective action. High DC cable losses in operating PV plants typically arise from the following factors::
1. Undersized cable cross-sections
This is a design-stage decision that results in permanently higher resistive losses. Using smaller-than-optimal cable sizes increases I²R losses over the plant lifetime.
2. Long DC cable runs
Resistance increases linearly with cable length. A longer cable run results in proportionally higher resistance and therefore higher I²R losses, assuming the same current.
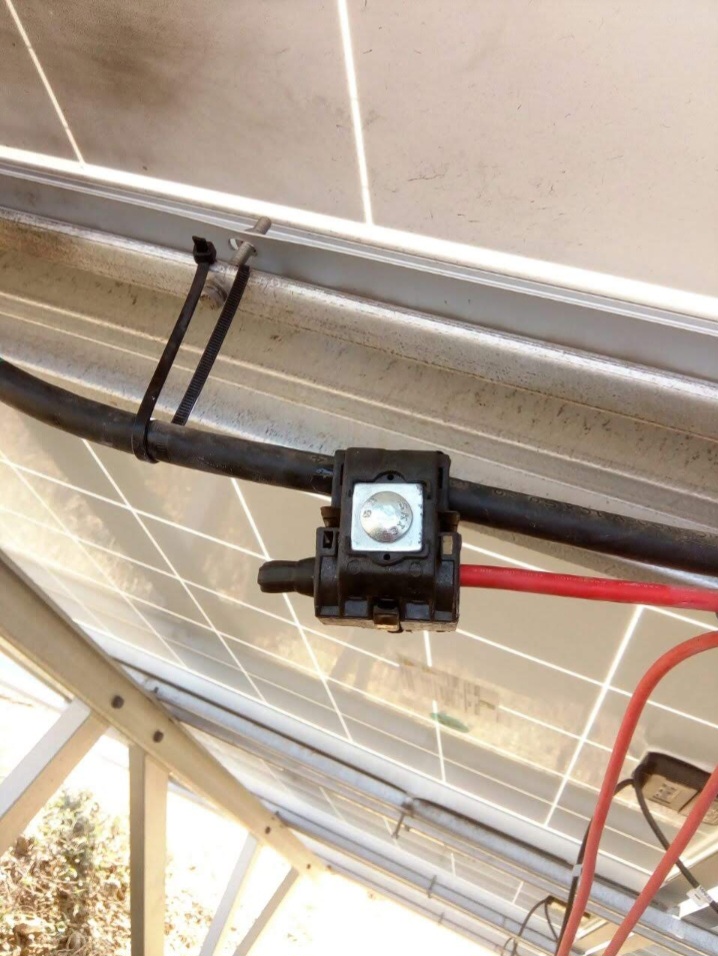
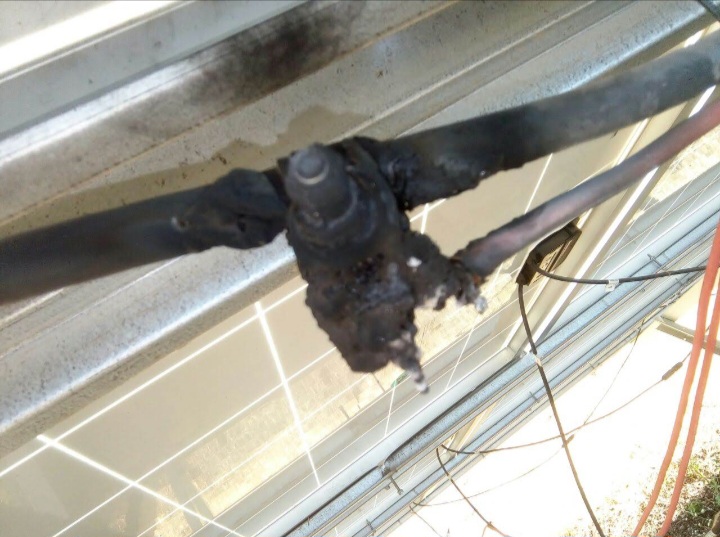
3. Corroded or degraded connectors
MC4 connectors and combiner box terminals can develop increased contact resistance over time due to moisture ingress, oxidation, or poor installation. Even small increases in contact resistance can lead to localized heating and additional energy losses.
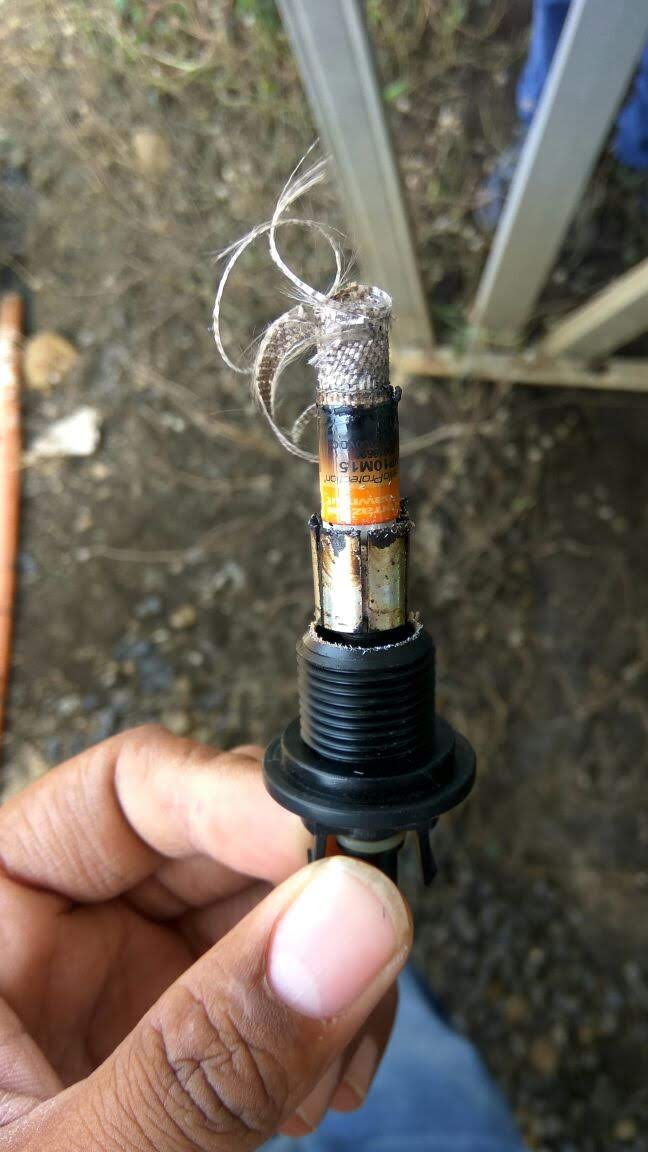
4. Loose or improperly crimped terminations
Terminations that are not crimped correctly, or that have loosened due to thermal cycling, create hotspots and increased resistance at junction points. These are harder to detect with monitoring alone — they typically show up during an infrared (IR) thermography inspection of the DC distribution system.
Reducing DC Cable Losses: Practical Steps for O&M Teams
Once DC cable losses are identified in a PR report, corrective actions depend on the underlying cause.
- Connector inspection and condition verification: Inspect MC4 connectors and combiner box terminals during scheduled O&M activities. Replace connectors showing signs of overheating, corrosion, or loose connection.
- Infrared thermography scans: Conduct periodic IR scans of DC cables, connectors, and combiner boxes. Persistent or abnormal hotspots indicate increased contact resistance or wiring issues that require corrective action. Note that hotspots caused by cable resistance are different from panel-level hotspots — read our article on the hotspot effect in solar panels to understand the distinction between the two.
- Replace degraded connectors: If IR inspection reveals persistently high-temperature junctions, replacing affected connectors is typically more cost-effective than allowing continued energy loss.
- Upgrade undersized cables where economically justified: In long-life plants, upgrading undersized DC cable runs can improve performance if the additional energy yield justifies the cost of replacement.
- String-level current monitoring: String-level monitoring can help identify abnormal performance when analyzed under consistent irradiance conditions, enabling early detection of resistive losses. See our detailed comparison of string-level vs plant-level monitoring to understand which setup gives you earlier visibility of cable degradation.
For new plant designs, the best practice is to design string cables for a maximum voltage drop of 1–1.5% on each string. General electrical codes such as NEC provide broader guidance around 2% DC voltage drop limits, depending on application.
Frequently Asked Questions
What is an acceptable DC cable loss percentage in a solar PV plant?
Well-designed plants with 4-10 mm² cables see annual energy losses of 0.2% to 0.6%. Values consistently above 1.5% suggest undersized cables, excessive string lengths, or degraded connectors and warrant investigation. Note that NEC's 2% is a voltage drop design guideline, not an energy loss target.
How do DC cable losses affect the Performance Ratio (PR)?
DC cable losses reduce the energy delivered from the PV array to the inverter. In PR (IEC 61724), this appears as part of DC system losses, so higher cable losses reduce final AC energy and therefore reduce PR. In non-clipping conditions, a 1% DC energy loss reduces PR by approximately 1% relative (e.g., PR 0.800 → 0.792). With inverter clipping (DC/AC ratio >1.2), the impact may be lower. Always evaluate your plant's clipping profile.
Can DC cable losses increase over time?
Yes. Corrosion at connectors and MC4 joints, UV degradation of insulation, and loose terminations all increase resistance over time, which raises wiring losses. A PR trend showing gradual multi-year decline — with temperature and soiling ruled out — can point to cable or connector degradation.
Where exactly should DC cable losses appear in a PR report?
DC cable losses are shown in the DC losses section of the PR loss breakdown. They are reported as a percentage of DC energy from the PV array and represent resistive losses in the DC wiring between the modules and the inverter DC input, in line with the IEC 61724-1 loss structure.
What formula calculates DC cable power loss in a solar string?
Power loss (W) = I² × R, where I is the string current (A) and R is the total round-trip resistance of the cable run (Ω). To express as a percentage: Cable Loss % = (Power Loss / DC string power at operating conditions) × 100. The round-trip resistance is calculated as R = ρ × (2L / A), using copper resistivity ρ ≈ 0.0178 Ω·mm²/m at 20°C (higher at operating temperature).
Is a 3% DC cable loss a problem in a solar PV plant?
Yes. A 3% DC cable loss is higher than typical PV design practice. Well-designed solar PV systems usually target about 1–2% DC voltage drop. At 3%, it often indicates undersized cables, long cable runs, or increased resistance in connectors or terminations. A DC cable audit is recommended to identify the cause and assess energy losses.
Pulling It Together
DC cable losses are not dramatic — they don't trip alarms or stop a plant from operating. But they reduce energy yield and PR over time, and can increase as connectors and terminations degrade with age.
The good news is that they can be calculated using the I²R formula and the installed cable details (lengths, cable sizes, and layout). Expected losses can be calculated from design information, while monitoring data can be used to track actual losses and identify trends.
In a PR report, DC cable losses should be listed as a separate item so they can be tracked and acted on by O&M teams.
Clear reporting of DC cable losses helps identify issues early and supports better maintenance decisions in both small and large PV plants.
Calculate your plant's PR right now using our Capacity Based PR calculator — or use the Temperature Corrected PR version if your site runs hot. To see all losses together, the Plant & Grid Generation Loss calculator gives you the full breakdown in one place.
Further reading: String-level vs Plant-level Monitoring — and why it matters for catching cable losses early.
Sources & References
- Sandia National Laboratories / PVPMC. DC Wiring Losses. pvpmc.sandia.gov
- IEC 61724-1:2021. Photovoltaic system performance — Part 1: Monitoring. International Electrotechnical Commission.
- NREL. Weather-Corrected Performance Ratio. NREL/TP-5200-57991. docs.nrel.gov
- PVsyst. Performance Ratio — Help Documentation. pvsyst.com