Which Solar Performance Ratio Should You Use? Capacity, Efficiency, Instantaneous & Temperature-Corrected PR Compared
Performance Ratio (PR) is the most widely used KPI for solar plant performance analysis, but it isn't a single calculation. Capacity-based PR, efficiency-based PR, instantaneous PR, and temperature-corrected PR all answer different questions about how a plant is performing. Using the wrong one — or comparing two different PR types as if they were the same metric — is one of the most common mistakes in O&M reporting.
This guide explains why these methods exist, how they differ, and which one fits your specific analysis objective. For full formulas, worked examples, and step-by-step calculation, each method links out to its dedicated calculator and methodology page.
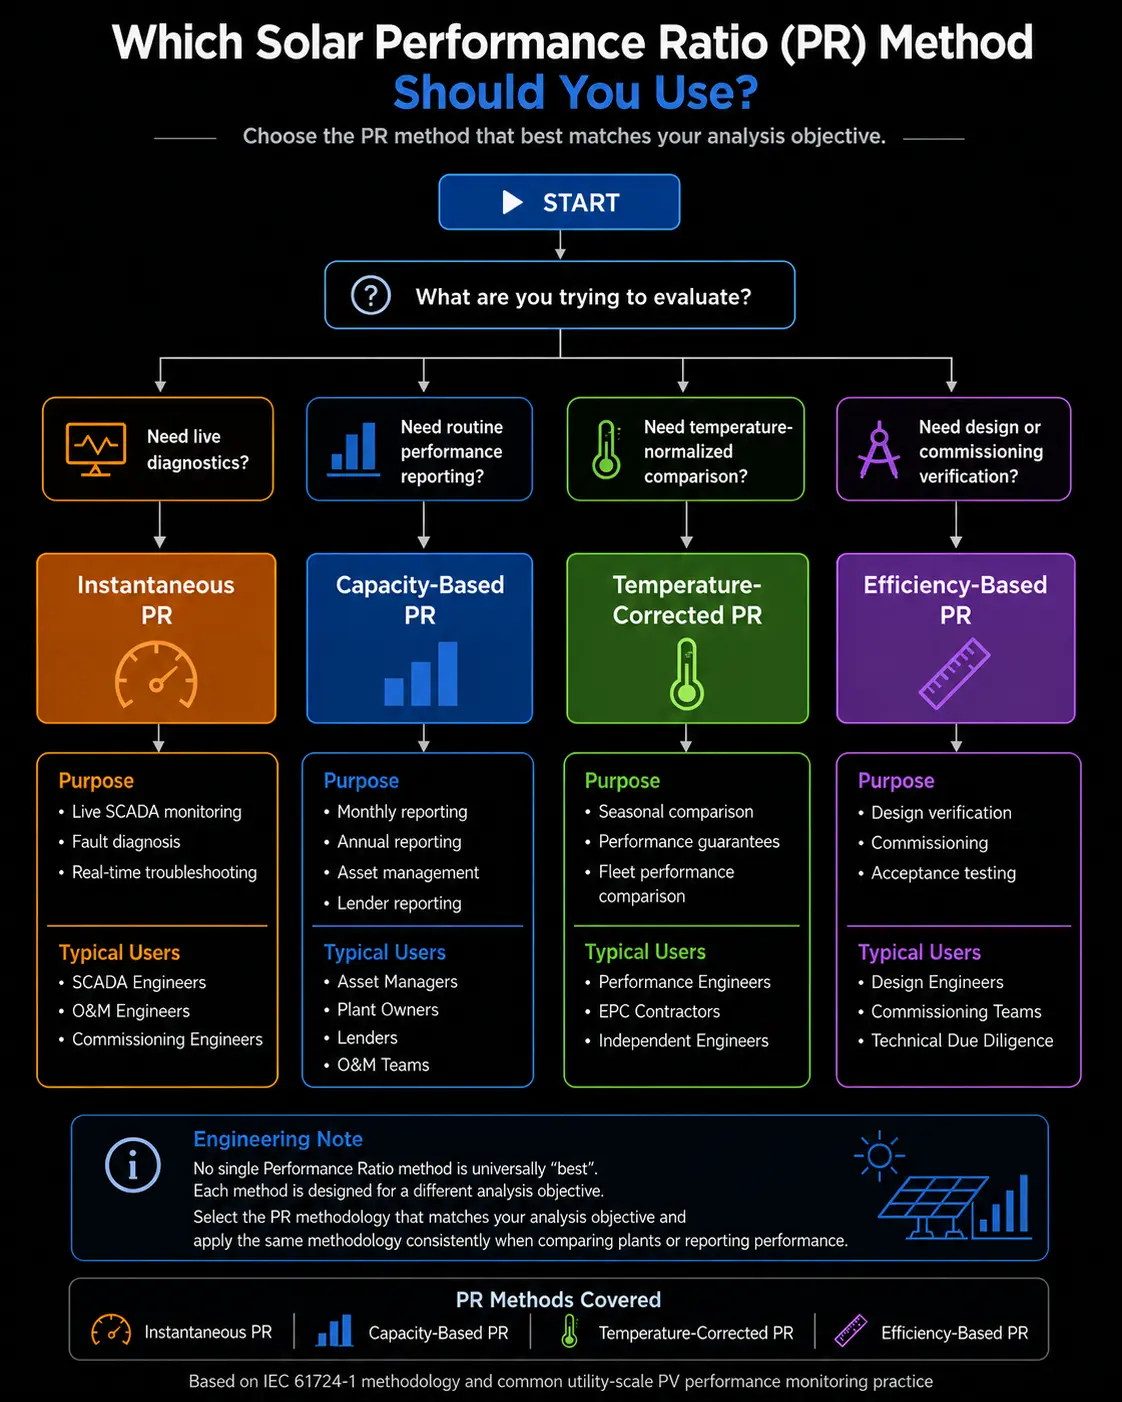
Quick answer:
- Capacity-Based PR → standard monthly or annual reporting
- Instantaneous PR → live SCADA monitoring and fault diagnosis
- Temperature-Corrected PR → seasonal comparison and contractual performance guarantees
- Efficiency-Based PR → commissioning and design verification
Why Multiple PR Methods Exist
IEC 61724-1 defines PR as the ratio of Final Yield (energy delivered per kW of installed capacity) to Reference Yield (the energy that capacity would deliver at standard test conditions under the measured irradiance). In practical terms, that means comparing actual output to a loss-free theoretical output — but the precise IEC definition matters, because the inputs and time resolution you use to build that ratio change depending on what you're trying to find out.
A SCADA engineer watching live inverter output needs a different calculation than an asset manager comparing a plant's June performance to its December performance, or a lender running technical due diligence on a plant's design assumptions. Each of these use cases produces a different PR variant — not because the underlying physics changes, but because the inputs, the time resolution, and the question being asked are different.
Before Calculating Any PR
Every PR method is only as good as the data feeding it. Before trusting any PR figure — regardless of which method produced it — check the basics:
- Verify POA sensor calibration and tilt alignment against the array.
- Remove nighttime and near-zero irradiance values, which produce unstable ratios.
- Exclude inverter clipping periods if your methodology requires it.
- Filter missing or interpolated SCADA values rather than treating gaps as zero output.
- Validate that energy and irradiance timestamps are aligned to the same interval.
A surprising PR swing is worth checking against the data before troubleshooting plant equipment. Before investigating inverters or strings, verify that the underlying irradiance, energy, and temperature data are reliable.
PR Methods Compared
| PR Method | What It Measures | Best Use Case | Required Data | Advantages | Limitations |
|---|---|---|---|---|---|
| Capacity-Based PR | Energy output vs. theoretical energy based on installed DC capacity and measured reference irradiance | Long-term trend tracking, lender/auditor due diligence | AC energy, DC capacity, POA insolation | Standard IEC-aligned reference metric; widely understood | Sensitive to irradiance sensor errors; not temperature-normalized |
| Efficiency-Based PR | Conversion performance relative to physical module area and rated efficiency | Design verification, commissioning, independent engineering assessments | Energy, POA insolation, active module area, rated module efficiency | Ties performance back to physical design parameters | Invalid if mixed module types or unverified area/efficiency data are used |
| Instantaneous PR | Real-time AC power normalized by installed DC capacity and instantaneous POA irradiance | Live SCADA diagnostics, fault detection, commissioning checks | AC power, DC capacity, irradiance (W/m²) at one moment | Immediate visibility into operating issues | Fluctuates with cloud transients and sensor timing offsets; not for contractual reporting |
| Temperature-Corrected PR | PR normalized to 25°C STC conditions | Seasonal benchmarking, contractual performance guarantees | Energy, DC capacity, POA insolation, average module temperature, temperature coefficient | Removes thermal bias for fair month-to-month or season-to-season comparison | Assumes linear temperature behavior; less precise with only average (not interval) temperature data |
Capacity-Based PR
Capacity-based PR compares actual AC energy output against the theoretical energy based on installed DC capacity and measured reference irradiance over a reporting period. It's the closest thing to a default, IEC-aligned PR figure, and it's typically what people mean when they say "PR" without qualification.
Use it for monthly or annual trend tracking, and whenever an external party — a lender, an auditor, an asset owner — wants a standard performance figure without deeper diagnostic context.
→ Full Capacity-Based PR Calculator and Methodology
Efficiency-Based PR
Efficiency-based PR evaluates how much of the available solar energy hitting the module surface is actually converted to electricity, based on net active module area and rated module efficiency rather than nameplate DC capacity. It connects performance directly to the physical array design.
It's most useful during commissioning and design verification, or in independent engineering reviews where component-level assumptions need to be checked. It loses validity quickly on plants with mixed module types or uncertain area data. Although useful for engineering studies, it's less common than capacity-based PR for routine operational reporting — most O&M teams won't track it month to month.
→ Full Efficiency-Based PR Calculator and Methodology
Instantaneous PR
Instantaneous PR captures real-time conversion efficiency at a single moment, comparing live AC power to DC capacity, normalized against current irradiance. It's built for diagnostics, not reporting.
SCADA analysts and commissioning engineers use it to spot inverter faults, string issues, or sensor problems as they happen. Because it reacts to cloud transients and brief irradiance spikes, it should never be used as a standalone benchmark for long-term performance.
→ Full Instantaneous PR Calculator and Methodology
Temperature-Corrected PR
Temperature-corrected PR adjusts the raw PR figure to account for module temperature deviation from the 25°C STC reference, using the module's power temperature coefficient. It answers: how would this plant have performed at standard temperature?
This is the right method when comparing a plant's performance across seasons, or when a raw PR figure looks artificially low simply because it was a hot month. Many performance guarantees specify temperature-corrected PR as the contractual basis, though the specific contract language should always take precedence over general practice. When applying temperature correction, use the γPmax value from the specific module datasheet rather than a generic default — the coefficient varies meaningfully across module technologies.
→ Full Temperature-Corrected PR Calculator and Methodology
The quickest way to choose the right Performance Ratio method is to start with the engineering question you need to answer. The decision guide below summarizes the most appropriate choice for common utility-scale PV analysis tasks.
How to Choose the Right PR Method
Match the method to the question you're actually asking, not to whichever PR figure is easiest to pull from your data:
- Need a live, real-time health check? Use instantaneous PR.
- Reporting a standard monthly or annual KPI? Use capacity-based PR.
- Comparing summer performance to winter performance, or checking a performance guarantee? Use temperature-corrected PR.
- Verifying design assumptions or running commissioning checks tied to module specs? Use efficiency-based PR.
- Comparing PR across a fleet of plants in different climates? Temperature-corrected PR is generally the fairer basis, since raw capacity-based PR will penalize plants in hotter sites for reasons unrelated to system health.
In practice, the decision usually comes down to what's in front of you at the moment:
- An inverter alarm fires at 2 PM — you don't pull up a monthly PR report, you check instantaneous PR against current irradiance.
- A lender asks for a quarterly performance summary — you don't hand them instantaneous PR snapshots, you report capacity-based PR over the period.
- You're comparing a plant in Rajasthan in May against one in Himachal Pradesh in December — raw PR alone will mislead you; temperature-corrected PR removes the thermal distortion so the comparison means something.
Common Mistakes Engineers Make With PR
Comparing different PR methods directly
A capacity-based PR of 78% and a temperature-corrected PR of 82% from the same plant aren't contradictory — they're answering different questions. Comparing PR figures across plants or time periods only works if both figures came from the same method.
Ignoring irradiance sensor quality
Every PR method that uses POA insolation is only as reliable as the sensor producing that number. A misaligned or uncalibrated pyranometer can shift PR by several percentage points before any real plant issue is involved.
Using incorrect temperature assumptions
Temperature correction calculated from a single average module temperature value, rather than interval-level data, will understate or overstate the correction during periods of high temperature variability within the day.
Misinterpreting seasonal PR changes
A PR drop in summer is often expected thermal behavior, not a fault. In utility-scale plants, raw PR routinely dips during hot summer afternoons even when every inverter and string is operating exactly as designed — module temperature alone accounts for it. Before escalating a seasonal PR decline as a performance issue, check it against temperature-corrected PR first.
PR in Context With Other Plant KPIs
PR is one of several KPIs used to evaluate solar plant health, not a standalone verdict. Engineers typically read it alongside Specific Yield, Plant and Grid Availability, and generation loss analysis to understand why performance changed, not just that it changed. A PR drop with stable availability points toward irradiance or thermal effects; a PR drop alongside falling availability points toward downtime or grid curtailment instead.
Conclusion
No single PR method is "the best" one. Capacity-based PR is the standard reporting figure. Efficiency-based PR ties performance to physical design. Instantaneous PR is built for live diagnostics. Temperature-corrected PR removes thermal bias for fair seasonal and contractual comparisons. The right choice depends entirely on what you're trying to find out — pick the method that matches your question, then use the dedicated calculator below to run the full calculation.
→ Capacity-Based PR · Efficiency-Based PR · Instantaneous PR · Temperature-Corrected PR
Frequently Asked Questions
What is the difference between capacity-based PR and efficiency-based PR?
Capacity-based PR normalizes against installed DC nameplate capacity. Efficiency-based PR normalizes against physical module area and rated module efficiency instead. They can produce different results on the same plant if nameplate capacity and actual physical module specs don't align precisely.
Can I use instantaneous PR for monthly reporting?
No. Instantaneous PR reflects a single moment and fluctuates with short-term irradiance and operating conditions. Monthly or annual reporting should use capacity-based or temperature-corrected PR instead.
Why does my PR look lower in summer?
Higher module temperatures reduce power output below the 25°C STC reference, which is expected thermal behavior rather than a fault. Temperature-corrected PR removes this effect for a fairer comparison across seasons.
Which PR method should I use for a performance guarantee check?
Many guarantees specify temperature-corrected PR as the basis, but the governing contract language should always take precedence over general practice.
Is a higher PR always better?
Generally yes within realistic bounds, but PR values approaching or exceeding the high end of the typical range for a given method often indicate a data or sensor issue rather than genuine overperformance, and should be checked before being reported as-is.
Can PR be compared between two different solar plants?
Only carefully, and only using the same PR method for both. Differences in climate, module technology, and DC oversizing can distort a direct comparison even when the calculation method matches.
Why do SCADA PR readings and the monthly PR report not match?
They're usually answering different questions. SCADA typically shows instantaneous PR at a point in time, reacting to short-term irradiance swings and transient conditions. The monthly report is built from capacity-based or temperature-corrected PR aggregated over the full period. A mismatch between the two is expected, not necessarily an error.
About the Author
Aman Yadav is a Solar Power Plant Performance & PR Analysis Engineer with 8+ years of hands-on experience in utility-scale PV plant performance analytics, including Performance Ratio evaluation, temperature loss modeling, and SCADA-based diagnostics. His work focuses on plane-of-array (POA) irradiation analysis, DC-to-AC loss breakdown, and seasonal PR benchmarking for accurate plant comparison. He built the calculators referenced in this article based on IEC 61724-1 methodology and real O&M reporting practice.