You have a temperature-corrected PR calculation open. You pull the Module Temp column from your SCADA export. You run the numbers. But somewhere at the back of your mind a question sits unanswered: is this the right temperature to use?
The datasheet states the power temperature coefficient is −0.43 %/°C — but referenced to what? The SCADA logs a channel labelled "Module Temp" — but where is that sensor physically located? And what did IEC 61724-1 actually intend by "module temperature"?
These are not abstract questions. On 10 April 2017, I pulled one day of 15-minute SCADA data from a plant running HTi Solar HT60-156P-265 polycrystalline modules. Peak backsheet temperature logged by the RTD: 60.8°C. Estimated peak cell temperature: 62.3°C. The resulting systematic error in temperature-corrected PR if you use the raw backsheet reading: up to −0.78% at peak irradiance, averaging −0.60% across daylight hours weighted by POA.
At fleet level across summer months, that error compounds. This article works through exactly where it comes from and what you should do about it.
The Short Version
Your SCADA typically logs backsheet surface temperature, not cell junction temperature. The manufacturer's power temperature coefficient (γ) is calibrated to cell temperature. Applying a cell-calibrated coefficient to a backsheet reading introduces a small, systematic under-correction in temperature-corrected PR — typically −0.5% to −0.8% at peak irradiance for glass-backsheet modules, larger for glass-glass bifacial. The two temperatures cannot be directly interchanged without a correction based on module construction, irradiance level, and thermal properties.
Four Temperatures in a Solar Plant — Your SCADA Gives You One
Before doing any calculations, establish exactly which temperature you are discussing — because the literature conflates these terms routinely.
Temperature Layers in a Glass-Backsheet PV Module
The engineering problem is this: your temperature-corrected PR formula needs Tcell, the manufacturer's γ is calibrated to Tcell, but the only number you have from SCADA is Tbacksheet. The gap between them is real, systematic, and irradiance-dependent.
What the NOCT Value on Your Module Nameplate Encodes
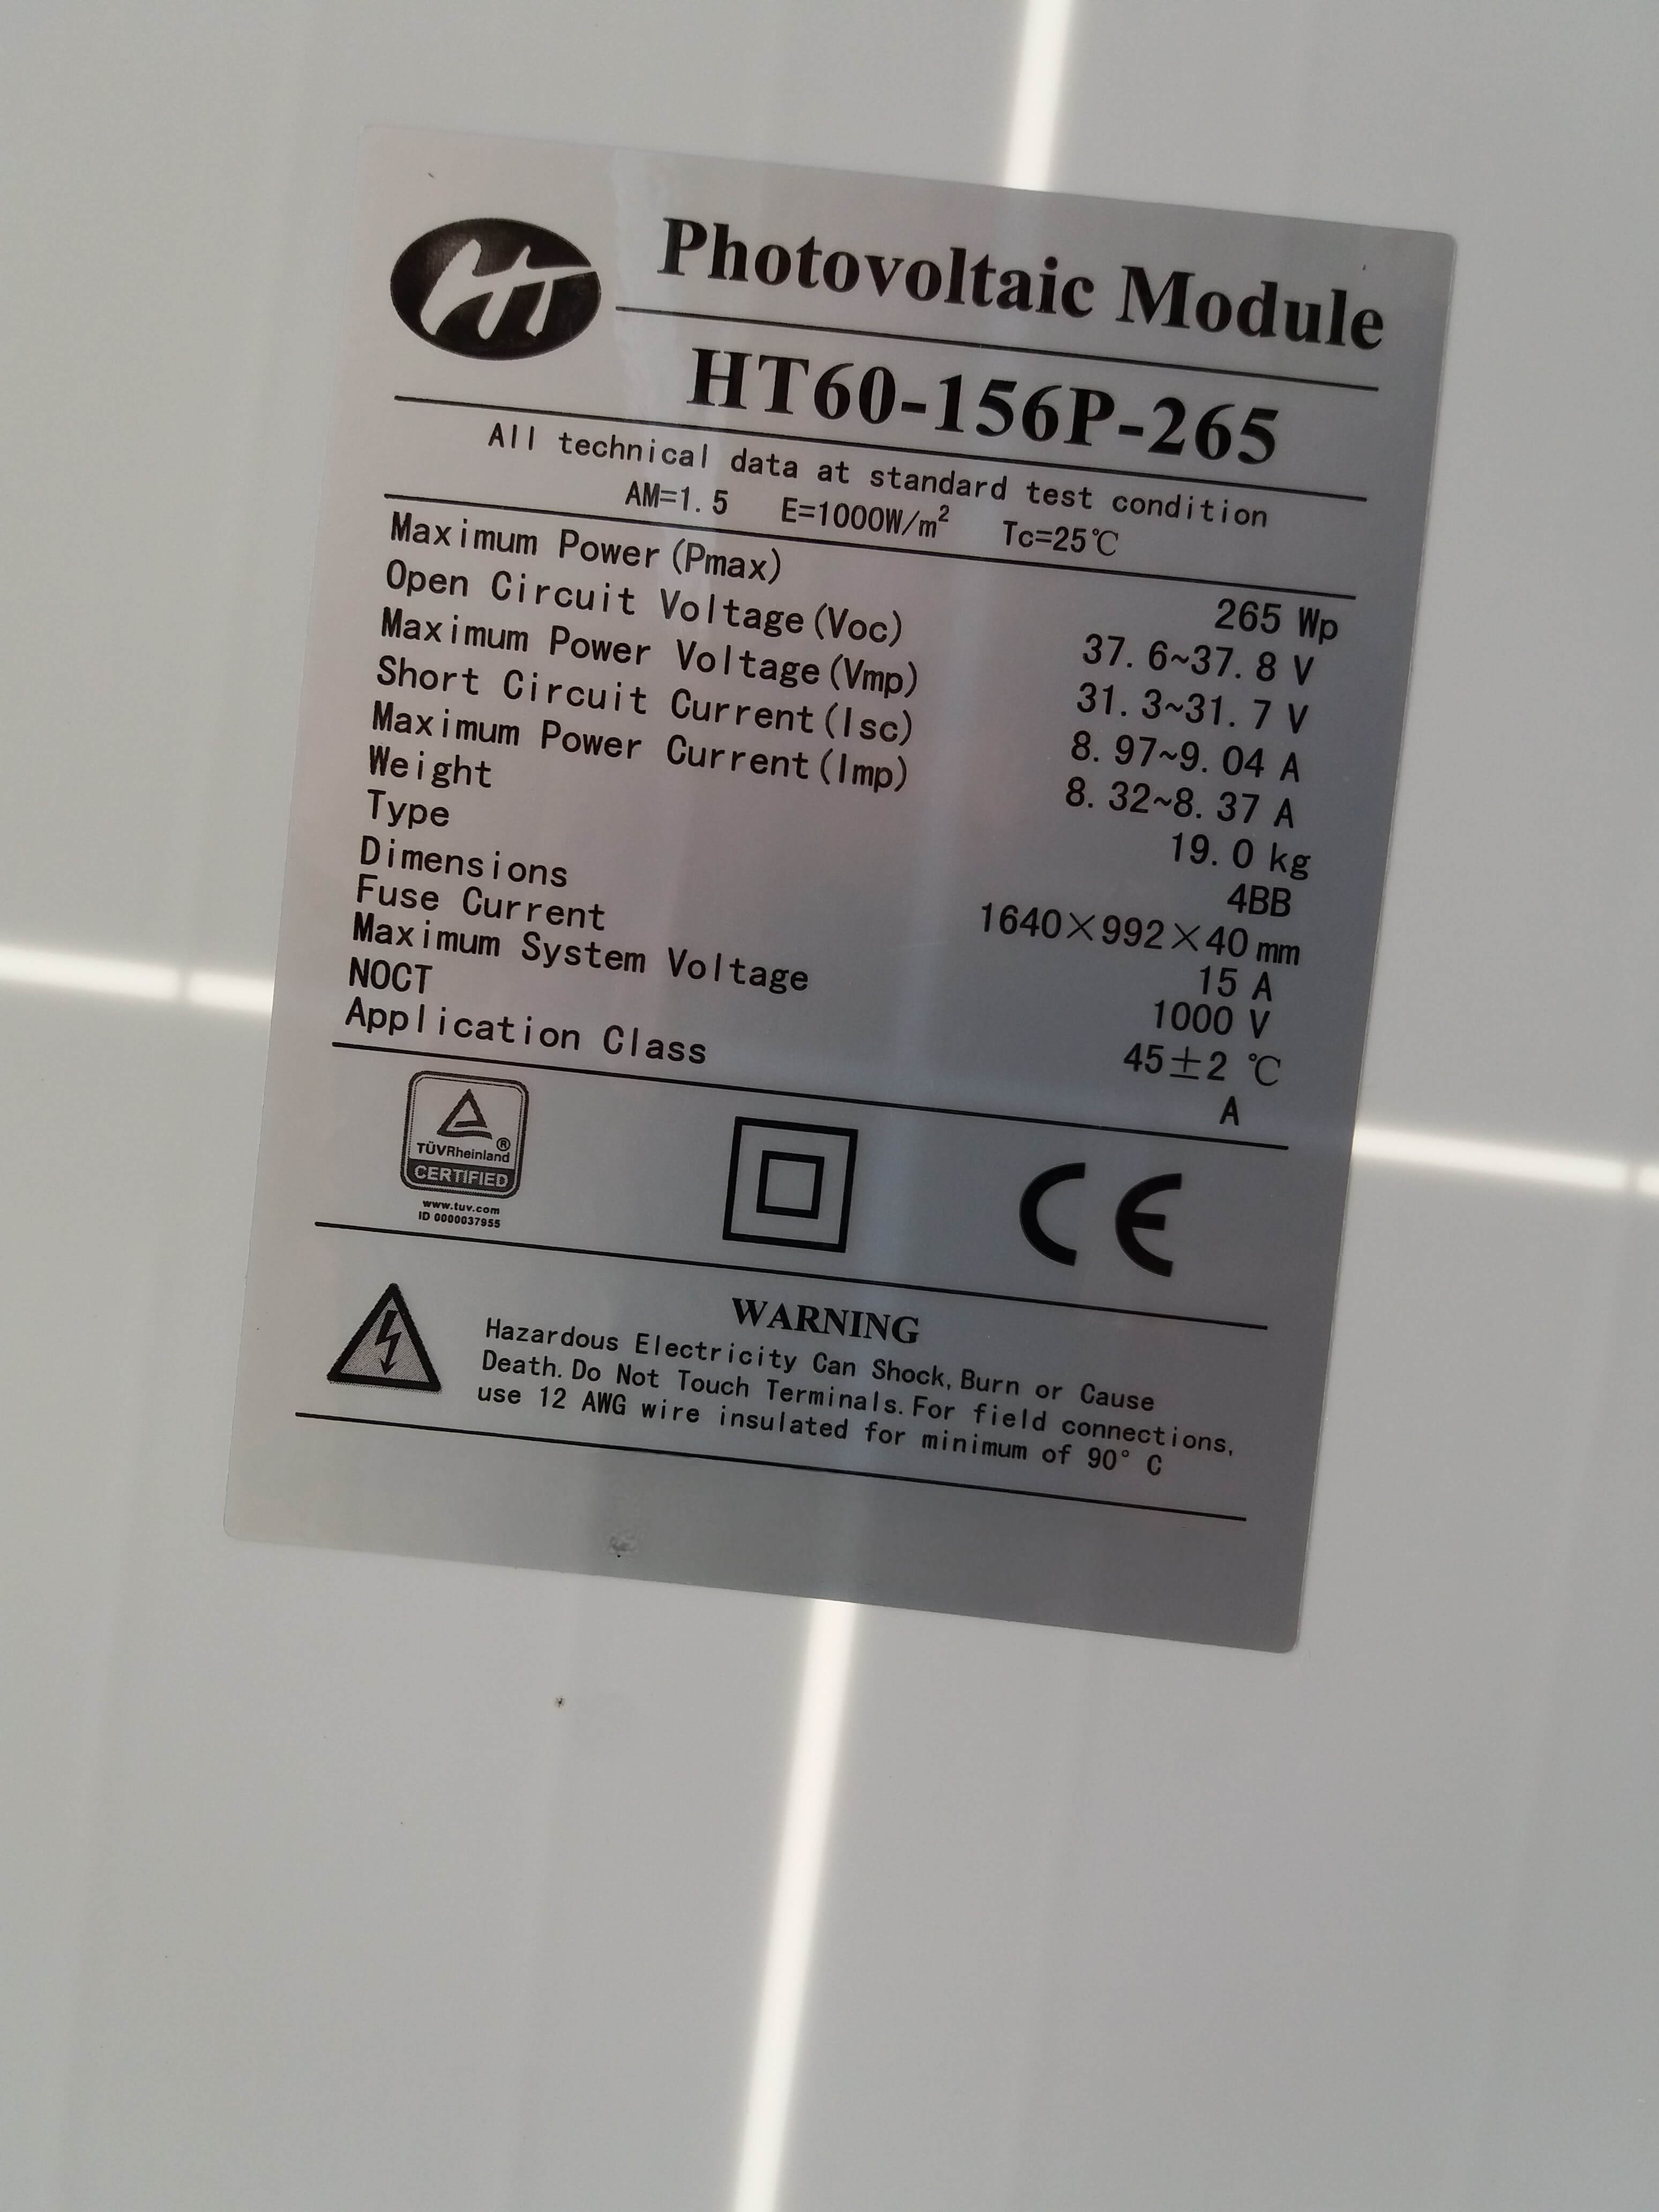
The nameplate on these modules shows NOCT = 45 ± 2°C. That value carries more information than most engineers extract from it.
Per IEC 61215, Nominal Operating Cell Temperature (NOCT) is defined as the cell junction temperature reached by the module under: irradiance = 800 W/m², ambient = 20°C, wind = 1 m/s, open-rack mounting, and the module operating at maximum power point. It is not the backsheet temperature. It is not the average module temperature. It is specifically Tcell.
The IEC 61215 test protocol records Tcell and Tbacksheet simultaneously and documents a consistent finding: under NOCT conditions, Tcell = Tbacksheet + 1.3°C.
How the Cell-to-Backsheet Delta Scales with Irradiance
That 1.3°C value is documented under a specific set of controlled NOCT test conditions — 800 W/m², 20°C ambient, 1 m/s wind, open-rack mounting. It is not a universal constant. In field conditions, the cell-to-backsheet delta varies with module construction (encapsulant thickness, backsheet thermal conductivity, number of EVA layers), mounting configuration, wind speed, module age, and soiling state. It tends to increase at higher irradiance and collapse during wind events.
For the glass-backsheet polycrystalline module analysed in this article (HT60-156P-265), an irradiance-scaled approximation based on IEC 61215 NOCT observations was applied as a working estimate:
Field Data: What the SCADA and IR Thermometer Show
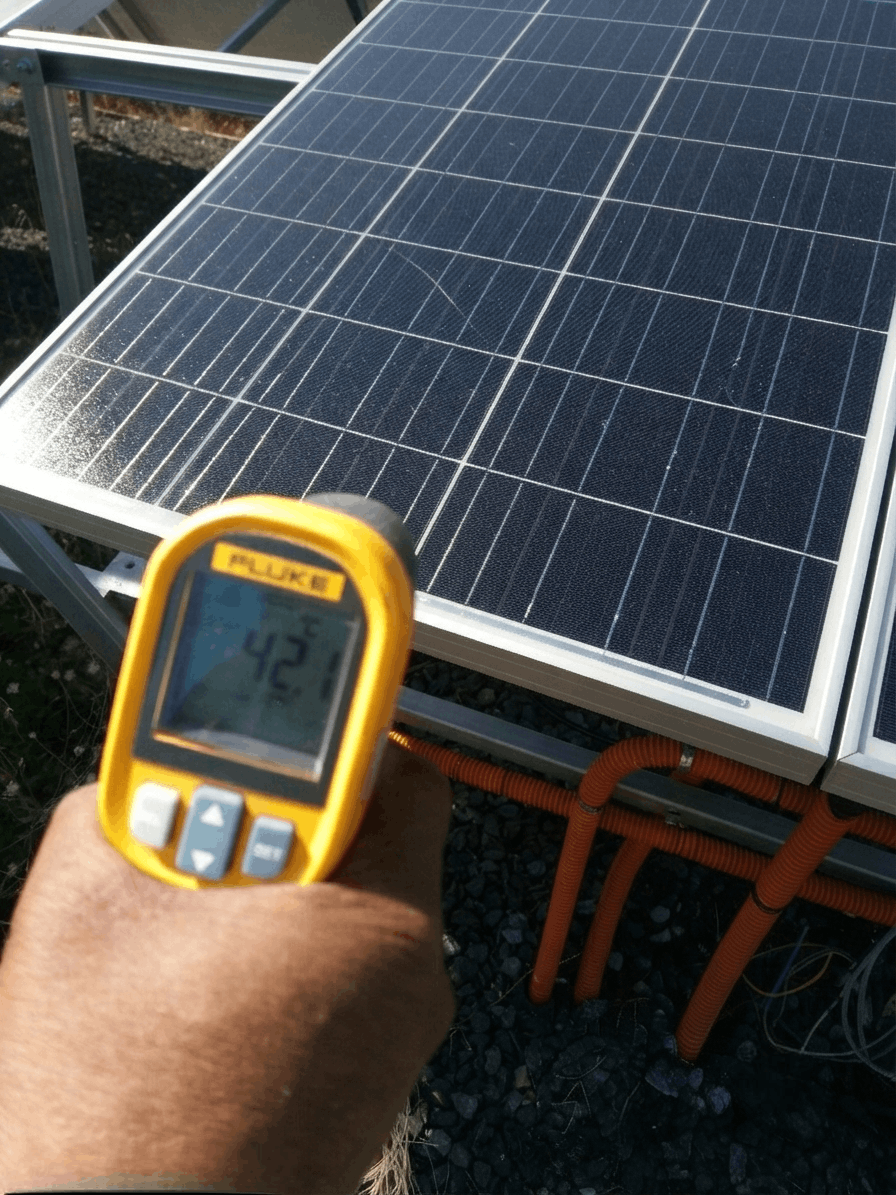
The photograph shows a Fluke infrared thermometer reading 42°C on the front glass of a polycrystalline module. This field reading illustrates a common confusion: the same module has at least three measurable temperatures (front glass, backsheet, and estimated cell), and the casual term "module temperature" does not specify which one.
Valid: quick hotspot pre-screening by comparing delta between modules on the same string. A module at 42°C when its neighbours are at 55°C at the same irradiance warrants investigation. Not valid: input to temperature-corrected PR, comparison against SCADA backsheet RTD, or absolute cell temperature estimation. If you are doing IR inspection, measure the backsheet for meaningful thermal data.
The April 10, 2017 Dataset: One Clear Day, 15-Minute Intervals
The SCADA dataset covers a single plant day: 10 April 2017, 15-minute intervals, three channels — GHI (W/m²), POA-1 (W/m²), and Module Temp (°C) from the backsheet RTD. Total daylight intervals with POA > 100 W/m²: 46 data points spanning 06:45 to 17:45. Daily POA insolation: 7.10 kWh/m² — a clear, high-irradiance spring day.
Module: HT60-156P-265, 265 Wp, glass-backsheet polycrystalline, 4-busbar, TÜV Rheinland certified, NOCT = 45 ± 2°C. Temperature coefficient of Pmax used in calculations: γ = −0.43 %/°C (representative value for 4BB poly modules of this generation — apply your actual datasheet value for site-specific work).
The 4.1°C Wind Cooling Event That Had Nothing to Do With Electrical Performance
Before getting into PR calculations, one data point in this dataset deserves specific attention because it is easy to misread in a PR analysis.
That 4.1°C drop at constant irradiance is a wind gust cooling event. The backsheet is a thin polymer film directly exposed to convection. It responds to wind faster than the cell, which has thermal mass (silicon + EVA) insulating it from rapid ambient changes.
This event changes the temperature-corrected PR for that 15-minute interval by ~2.1% — the TCF moves from 0.8394 to 0.8571. If you are doing root-cause analysis on interval-level temperature-corrected PR spikes, check for wind events before attributing volatility to electrical issues.
How Using Backsheet Temperature Affects Temperature-Corrected PR
The Temperature Correction Factor Formula
When you use a temperature that is lower than the actual cell temperature, TCF is slightly too high, so temperature-corrected PR comes out slightly lower than it should be. You are under-correcting for the temperature penalty. The module appears to perform worse than it actually does at STC-equivalent conditions.
PR Error: Interval by Interval from Real SCADA Data
| Time | POA (W/m²) | Tbacksheet (°C) | Tcell est. (°C) | Δ (°C) | TCF (backsheet) | TCF (cell) | PR error |
|---|---|---|---|---|---|---|---|
| 07:00 | 161 | 29.4 | 29.7 | 0.3 | 0.9811 | 0.9800 | −0.11% |
| 08:00 | 406 | 38.4 | 39.1 | 0.7 | 0.9424 | 0.9395 | −0.30% |
| 09:00 | 627 | 46.1 | 47.1 | 1.0 | 0.9093 | 0.9049 | −0.48% |
| 09:30 | 720 | 49.0 | 50.2 | 1.2 | 0.8968 | 0.8918 | −0.56% |
| 10:15 | 832 | 53.6 | 55.0 | 1.4 | 0.8770 | 0.8712 | −0.66% |
| 11:00 | 901 | 56.0 | 57.5 | 1.5 | 0.8667 | 0.8604 | −0.73% |
| 11:15 | 921 | 56.8 | 58.3 | 1.5 | 0.8633 | 0.8568 | −0.75% |
| 12:00 | 944 | 58.4 | 59.9 | 1.5 | 0.8564 | 0.8498 | −0.77% |
| 12:15 | 949 | 60.8 | 62.3 | 1.5 | 0.8461 | 0.8394 | −0.78% ↑ peak |
| 13:00 | 926 | 57.7 | 59.2 | 1.5 | 0.8594 | 0.8529 | −0.75% |
| 14:00 | 841 | 59.9 | 61.3 | 1.4 | 0.8499 | 0.8441 | −0.69% |
| 14:30 | 774 | 55.2 | 56.5 | 1.3 | 0.8701 | 0.8647 | −0.62% |
| 15:30 | 602 | 54.5 | 55.5 | 1.0 | 0.8731 | 0.8689 | −0.48% |
| 16:30 | 380 | 46.8 | 47.4 | 0.6 | 0.9063 | 0.9036 | −0.29% |
| 17:30 | 149 | 40.0 | 40.2 | 0.2 | 0.9355 | 0.9345 | −0.11% |
For intervals with POA > 800 W/m² (17 intervals, 255 minutes): average error = −0.73%.
How this reconciles with the calculator page's stated "1–2% variation": The calculations above use the IEC 61215 NOCT test-condition delta of 1.3°C (at 800 W/m², 20°C ambient, 1 m/s wind). Under real Indian field conditions — 35–40°C ambient, calm wind, 900–1000 W/m² — the cell-to-backsheet delta commonly reaches 2–3°C, as stated on the Temperature Corrected PR Calculator page. At 2°C delta, the peak PR error rises to ~−1.0%; at 3°C delta, to ~−1.5%. The calculator's "1–2% variation" is correct for typical field conditions. The values computed in this article represent the conservative lower bound using the IEC laboratory basis — not the ceiling.
Temperature Power Loss From STC — At Peak Irradiance
The cell temperature data also quantifies how much the temperature penalty alone is costing the 265 Wp module on this day, independent of the backsheet-vs-cell debate:
| Time | POA (W/m²) | Tcell est. (°C) | ΔT from STC (°C) | Power loss from STC | Pactual (W) |
|---|---|---|---|---|---|
| 09:30 | 720 | 50.2 | 25.2 | 10.8% | 236.3 |
| 11:00 | 901 | 57.5 | 32.5 | 14.0% | 228.0 |
| 11:30 | 931 | 61.3 | 36.3 | 15.6% | 223.6 |
| 12:00 | 944 | 59.9 | 34.9 | 15.0% | 225.2 |
| 12:15 | 949 | 62.3 | 37.3 | 16.1% | 222.4 W |
| 14:00 | 841 | 61.3 | 36.3 | 15.6% | 223.7 |
At peak, the cells are operating at 62.3°C — 37.3°C above STC. At γ = −0.43 %/°C, that is a 16.1% power reduction from nameplate, bringing 265 Wp down to approximately 222 W. Nothing is broken. This is expected thermal derating. Understanding the correct cell temperature is what lets you accurately attribute this loss in your performance analysis rather than chasing phantom electrical faults.
Annual-Scale Implications
The −0.60% daily average from this April dataset represents a high-irradiance day. Module temperatures are lower in winter months, so the cell-backsheet delta is smaller and the PR error is proportionally reduced.
What IEC 61724-1:2021 Actually Says
IEC 61724-1:2021 defines module temperature as: "temperature at the back surface of a representative module, measured by a sensor affixed to the rear surface."
It then uses this back-surface temperature — together with the manufacturer's temperature coefficient — in the temperature loss factor calculation for temperature-corrected PR.
This is the standard accepting a known approximation: utility-scale plants do not have cell-level temperature measurements, and back-surface RTDs are the practical field standard. The standard acknowledges the delta but accepts the backsheet reading within the overall PR measurement uncertainty, which IEC 61724-1 itself quantifies as ±2–5% depending on sensor quality, calibration interval, and data averaging.
Glass-Glass Bifacial Modules: The Delta Gets Substantially Larger
In a glass-glass module, the rear surface is 3.2 mm tempered glass instead of a ~0.3 mm backsheet composite. Glass conducts heat less efficiently than a TPT/TPE backsheet to ambient air, so the thermal resistance from cell to rear surface is higher. The steady-state cell-to-rear-surface delta in glass-glass modules is typically 2–5°C rather than 1.3°C at NOCT.
If you are running a glass-glass bifacial fleet and applying raw SCADA temperature to temperature-corrected PR without any correction, the systematic error is material — potentially exceeding 1% annually, which is above the threshold where it should appear as a named uncertainty in your performance report.
Where the IR Thermometer Fits in Field Practice
The 42°C Fluke reading on the module front glass is legitimate data. Here is precisely what it is and is not valid for.
Valid uses: Quick hotspot pre-screening by comparing temperature delta between modules on the same string at the same irradiance. A module at 42°C when its neighbours are at 55°C warrants investigation. Rough verification that SCADA is logging plausible values. Detecting gross anomalies before deploying drone thermography.
Not valid for: Cell temperature input to PR calculations — you are reading the glass surface, which is lower than cell temperature. Comparison against SCADA backsheet RTD values — you are on the wrong side of the module. Absolute thermal assessment of cell health — that requires calibrated IR cameras on the backsheet, preferably during thermographic inspection.
One additional practical consideration: IR thermometers assume an emissivity setting. Tempered solar glass has emissivity ~0.90–0.93, which most Fluke instruments default to accurately. For backsheet measurements, emissivity varies: white backsheets run ~0.88–0.92, black backsheets ~0.94–0.97. A gun set to 0.95 reading a white backsheet will read slightly higher than actual. Not large, but worth knowing when cross-checking SCADA RTD values against handheld measurements.
Five Common Temperature Measurement Mistakes in Solar PR Analysis
These are the errors that appear most frequently in O&M performance reports and root-cause investigations. Each one has a direct consequence for temperature-corrected PR accuracy.
- 01 Using front-glass IR thermometer readings as PR calculation inputs
- A handheld IR thermometer pointed at the front face of a module reads the glass surface temperature — not cell temperature, not backsheet temperature. As demonstrated in the field photograph in this article (42°C on front glass), this reading is valid for relative anomaly detection between modules on the same string. It is not a valid input to temperature-corrected PR and cannot be meaningfully compared against your SCADA module temperature channel.
- 02 Assuming SCADA "Module Temp" equals cell temperature
- The default temperature channel in most SCADA systems is an RTD bonded to the backsheet of a representative module — not the cell junction. The manufacturer's power temperature coefficient (γ) is calibrated to cell temperature in a lab setting. Applying it directly to the backsheet reading introduces the systematic error quantified in this article: −0.5% to −0.8% at peak irradiance for glass-backsheet modules, and up to −1.5% for glass-glass bifacial.
- 03 Directly comparing PVsyst simulated temperature with SCADA backsheet temperature
- This is the most consequential error in post-commissioning P50 verification. PVsyst computes cell temperature using a thermal model (Faiman or Uc/Uv) parameterised to the module's NOCT. Your SCADA logs a physical backsheet RTD reading. Comparing them directly conflates two fundamentally different quantities. PVsyst cell temperature will typically be 1–3°C higher than your SCADA backsheet reading under identical irradiance. That difference alone can explain a 0.5–1.2% simulated-vs-actual PR gap with no actual system underperformance.
- 04 Ignoring wind speed when interpreting module temperature data
- As shown in this dataset — a 4.1°C backsheet temperature drop at 12:15→12:30 at constant irradiance (949 W/m²) — wind events cause SCADA module temperature to move sharply in a direction unrelated to electrical performance. Before attributing interval-level temperature-corrected PR spikes to inverter behaviour, soiling, or string faults, check available anemometer data. Wind-cooling transients are a common source of misattributed PR anomalies in O&M reports.
- 05 Applying one correction factor across all module technologies
- The 1.3°C IEC 61215 delta applies specifically to the glass-backsheet polycrystalline module analysed here. Glass-glass bifacial modules typically show 2–5°C cell-to-rear-surface delta. Thin-film modules (CdTe, CIGS) have different optical absorption profiles. TOPCon and HJT cells have lower temperature coefficients and different encapsulant properties. Using a blanket "module temp + 1.3°C = cell temp" rule across a mixed-technology fleet produces temperature-corrected PR values that are not comparable across sites.
Practical Recommendations for O&M Engineers
-
1Document exactly what your temperature sensor is measuring. Open your SCADA configuration or ask your monitoring vendor: is "Module Temp" from an RTD physically bonded to the backsheet of a specific module, or is it estimated from an ambient sensor using a thermal model (Faiman, NOCT linear, King/Sandia)? If estimated, what model parameters are used? The answer changes how you interpret every temperature-corrected PR report you have signed off on.
-
2Apply the IEC 61215 correction for single-day or high-irradiance period analysis. For any period where average POA exceeds 700 W/m², estimate cell temperature as Tcell ≈ Tbacksheet + 1.3 × (GPOA/800). For glass-glass bifacial, use 2.5–3.0 in place of 1.3, based on your module's rear-surface thermal data or field measurements where available.
-
3Flag measurement basis in fleet benchmarking. If you are comparing temperature-corrected PR across plants from different EPCs, confirm all sites use the same sensor type and placement. A plant using a NOCT-estimated cell temperature will systematically show higher temperature-corrected PR than one using raw backsheet RTD — not because it performs better, but because its temperature input is higher.
-
4Report with the appropriate uncertainty qualifier. For glass-backsheet modules, the systematic under-correction from raw backsheet temperature averages ~0.45% annually for a high-irradiance site. For glass-glass bifacial: ~0.8–1.0%. Both are within IEC 61724-1's stated PR measurement uncertainty, but they are worth a single-sentence note in any annual performance report that claims IEC 61724-1 compliance.
-
5Do not attribute wind-driven module temperature drops to electrical performance. A 4°C backsheet temperature drop in 15 minutes at constant irradiance — as seen at 12:15→12:30 in this dataset — has nothing to do with inverter or string behaviour. If your interval-level temperature-corrected PR analysis shows spikes coinciding with temperature drops on clear high-irradiance days, check meteorological data for wind events first.
Summary
| Parameter | Value / Finding |
|---|---|
| What SCADA "Module Temp" actually measures | Backsheet surface RTD temperature |
| What manufacturer's γ is referenced to | Cell junction temperature at STC (25°C cell) |
| Cell-backsheet delta — IEC 61215 NOCT test (800 W/m²) | ~1.3°C (controlled lab: 20°C ambient, 1 m/s wind) |
| Cell-backsheet delta — typical field conditions (India/desert) | 2–3°C (35–40°C ambient, calm wind, high irradiance) — see Temperature Corrected PR Calculator |
| Delta at peak irradiance (949 W/m², this dataset — IEC basis) | ~1.54°C (conservative lower bound) |
| PR under-correction range (IEC basis, this dataset) | −0.07% (low irradiance) to −0.78% (midday peak) — lower bound |
| PR error at 2–3°C field delta (typical real conditions) | ~−1.0% to ~−1.5% at peak — aligns with calculator's stated "1–2% variation" |
| POA-weighted daily average PR error | −0.60% (April, high irradiance day) |
| Annual weighted average PR error (estimated) | ~−0.45% |
| Glass-glass bifacial: typical delta | 2–5°C → proportionally larger PR error (~−0.8–1.2% annual) |
| IEC 61724-1:2021 position | Accepts backsheet RTD as practical proxy; within overall PR uncertainty budget |
| Wind events | Can cause 3–5°C backsheet temperature drops at constant irradiance — unrelated to electrical performance |
The temperature your SCADA measures and the temperature the datasheet coefficient was calibrated to are not the same thing. The gap is small per interval and is observed consistently at high irradiance under steady-state conditions. Using backsheet temperature in a temperature-corrected PR calculation will typically under-correct for the temperature penalty — making corrected PR appear marginally lower than its physically correct value. Wind events and transient cooling can temporarily narrow or reverse the gap, as shown in the 12:15→12:30 interval in this dataset.
Understanding this does not change how you operate the plant. It changes how accurately you read the numbers — and that matters for every performance report you sign off on.
Related Articles and Tools on Kindastuff Solar Analytics
The direct tool companion to this article is the Temperature Corrected PR Calculator. Its input field is labelled "Avg. Module Temperature (°C)" — the backsheet RTD reading discussed throughout this article — and its built-in note confirms that cell temperature is typically 2–3°C higher than that reading in field conditions. Everything in this article is the engineering explanation of what happens under the hood when you enter a value into that calculator.
Temperature-corrected PR sits within a broader framework of performance ratio methodology. If you are working through which PR variant to apply to your reporting context, Which Performance Ratio Should You Use? covers the trade-offs between measured PR, temperature-corrected PR, and energy-based PR under IEC 61724-1.
POA irradiance is the other critical input to any PR formula. Why GHI is the wrong denominator and how POA is derived is covered in What is Plane of Array (POA) Irradiance — And How is it Different from GHI?
If hotspot cells are present in your plant, be aware that localised cell temperatures can exceed bulk module temperature by 20–40°C. A hotspot cell at 85°C on a module whose backsheet RTD reads 58°C is entirely invisible to this analysis. See Hotspot Effect in Solar Panels: How It Reduces PR and How to Detect It for identification and quantification methodology.
For separating temperature-induced seasonal PR variation from actual long-term degradation in your CUF analysis, see Degradation & Insolation Corrected CUF Explained.
Data note: All calculations use real SCADA data (10 April 2017, 15-minute interval, 54 data points), real module nameplate values (HT60-156P-265, NOCT = 45 ± 2°C, Shanghai Aerospace Automobile Electromechanical Co.), and the IEC 61215 cell-to-backsheet delta basis. Temperature coefficient γ = −0.43 %/°C is used as representative of 4BB polycrystalline modules of this generation. Apply your actual datasheet value for site-specific calculations. No data was invented or borrowed from other sources.

Utility-scale PV performance analyst with hands-on O&M experience across multiple plants. Writes about PR methodology, SCADA diagnostics, energy yield analysis, and root-cause investigation from actual field observations — not generic technical content.