PV Soiling Losses: How Dust and Contamination Affect PR, CUF and Energy Yield in Utility-Scale Solar Plants
By Aman Yadav |
Soiling is a major performance loss in a utility-scale solar plant that you can reduce through module cleaning. Module degradation, thermal derating, cable resistance, and inverter clipping are managed through plant design, operation, and performance analysis. Soiling is different because cleaning directly reduces the loss.
But eliminating it effectively requires understanding what it does to your Performance Ratio, how different contamination types behave electrically, and how to confirm performance recovery after cleaning. Most O&M teams treat cleaning as a scheduling exercise. This article treats cleaning as a performance recovery operation, from detection through verification.
For clarity: soiling loss is the reduction in plant output caused by contamination on the module surface, and the soiling ratio is its complement, where soiling ratio = 1 − soiling loss.
What Soiling Does at the Cell Level
Dust and debris on module glass reduce the solar radiation reaching the active cell area. The result is lower effective irradiance (Geff) at the module surface.
Geff directly affects PV current generation. For crystalline silicon cells, short-circuit current (Isc) is approximately proportional to irradiance. A 3% reduction in Geff therefore produces roughly a 3% reduction in Isc, under comparable conditions. Modules in a string operate at the same current. Uniform soiling across the string reduces string current in proportion to the irradiance loss. Heavy contamination on one module limits string current and reduces the output of the other series-connected modules.
The performance impact chain is straightforward:
- Dust accumulates on module glass
- Geff at the cell surface decreases
- DC current output falls proportionally
- DC power and AC energy output fall
- Performance Ratio (PR) drops
Per IEC 61724-1, PR is calculated as:
PR = EAC / [ PSTC × (HPOA / Gref) ]
Where EAC is measured AC energy (kWh), HPOA is plane-of-array insolation (kWh/m²), Gref is the reference irradiance of 1 kW/m² (so HPOA/Gref is the reference yield in hours), and PSTC is nameplate DC capacity (kWp).
Soiling reduces EAC while HPOA stays largely unchanged at the pyranometer. The denominator stays roughly constant while the numerator decreases, so PR drops accordingly. This is why soiling suppresses PR even on days with no equipment faults, no grid curtailment, and no SCADA alarms.
One assumption matters here. This logic only holds if the irradiance sensor is itself clean and representative. A soiled or drifting pyranometer or reference cell reads lower than the true plane-of-array irradiance, which normalises away part of the module soiling loss and causes you to under-estimate the true soiling rate. Recent field work has shown that pyranometer soiling can cause the module soiling rate derived from performance-ratio data to be understated by roughly a third (Fuke & Kottantharayil, 2025). Clean and calibrate your irradiance sensors on the same schedule as the modules, and treat any period with a dirty sensor as unreliable for soiling analysis.
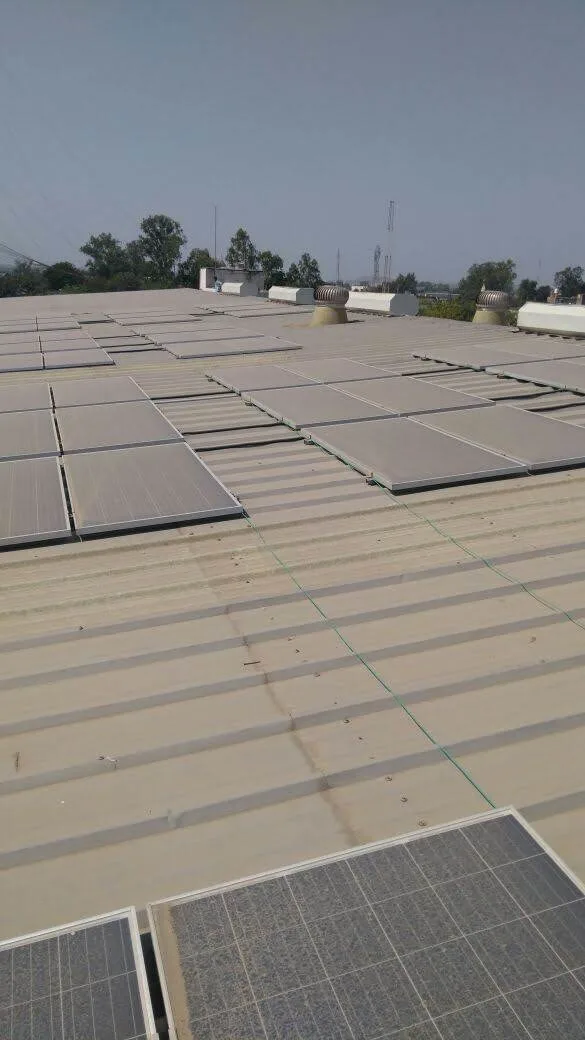
Contamination Types and Their Electrical Behavior
Not all soiling causes the same electrical effect. The type of contamination, its density, and how it distributes across the module surface determine both the severity of the output loss and the cleaning method needed to remove it.
Uniform Fine Dust
Fine airborne particles, including soil dust, road dust, and construction particulates, settle uniformly across module glass. As dust accumulates, less sunlight reaches the cells, reducing module output.
In agricultural and semi-arid regions, fine dust is a common soiling type at ground-mounted utility-scale plants. Rain removes some of the dust, but light rainfall on a dusty module often leaves a mud residue after drying instead of restoring the glass to a clean condition. The electrical signature is diffuse and proportional: every string in every inverter section shows a similar output reduction simultaneously.
Bird Droppings
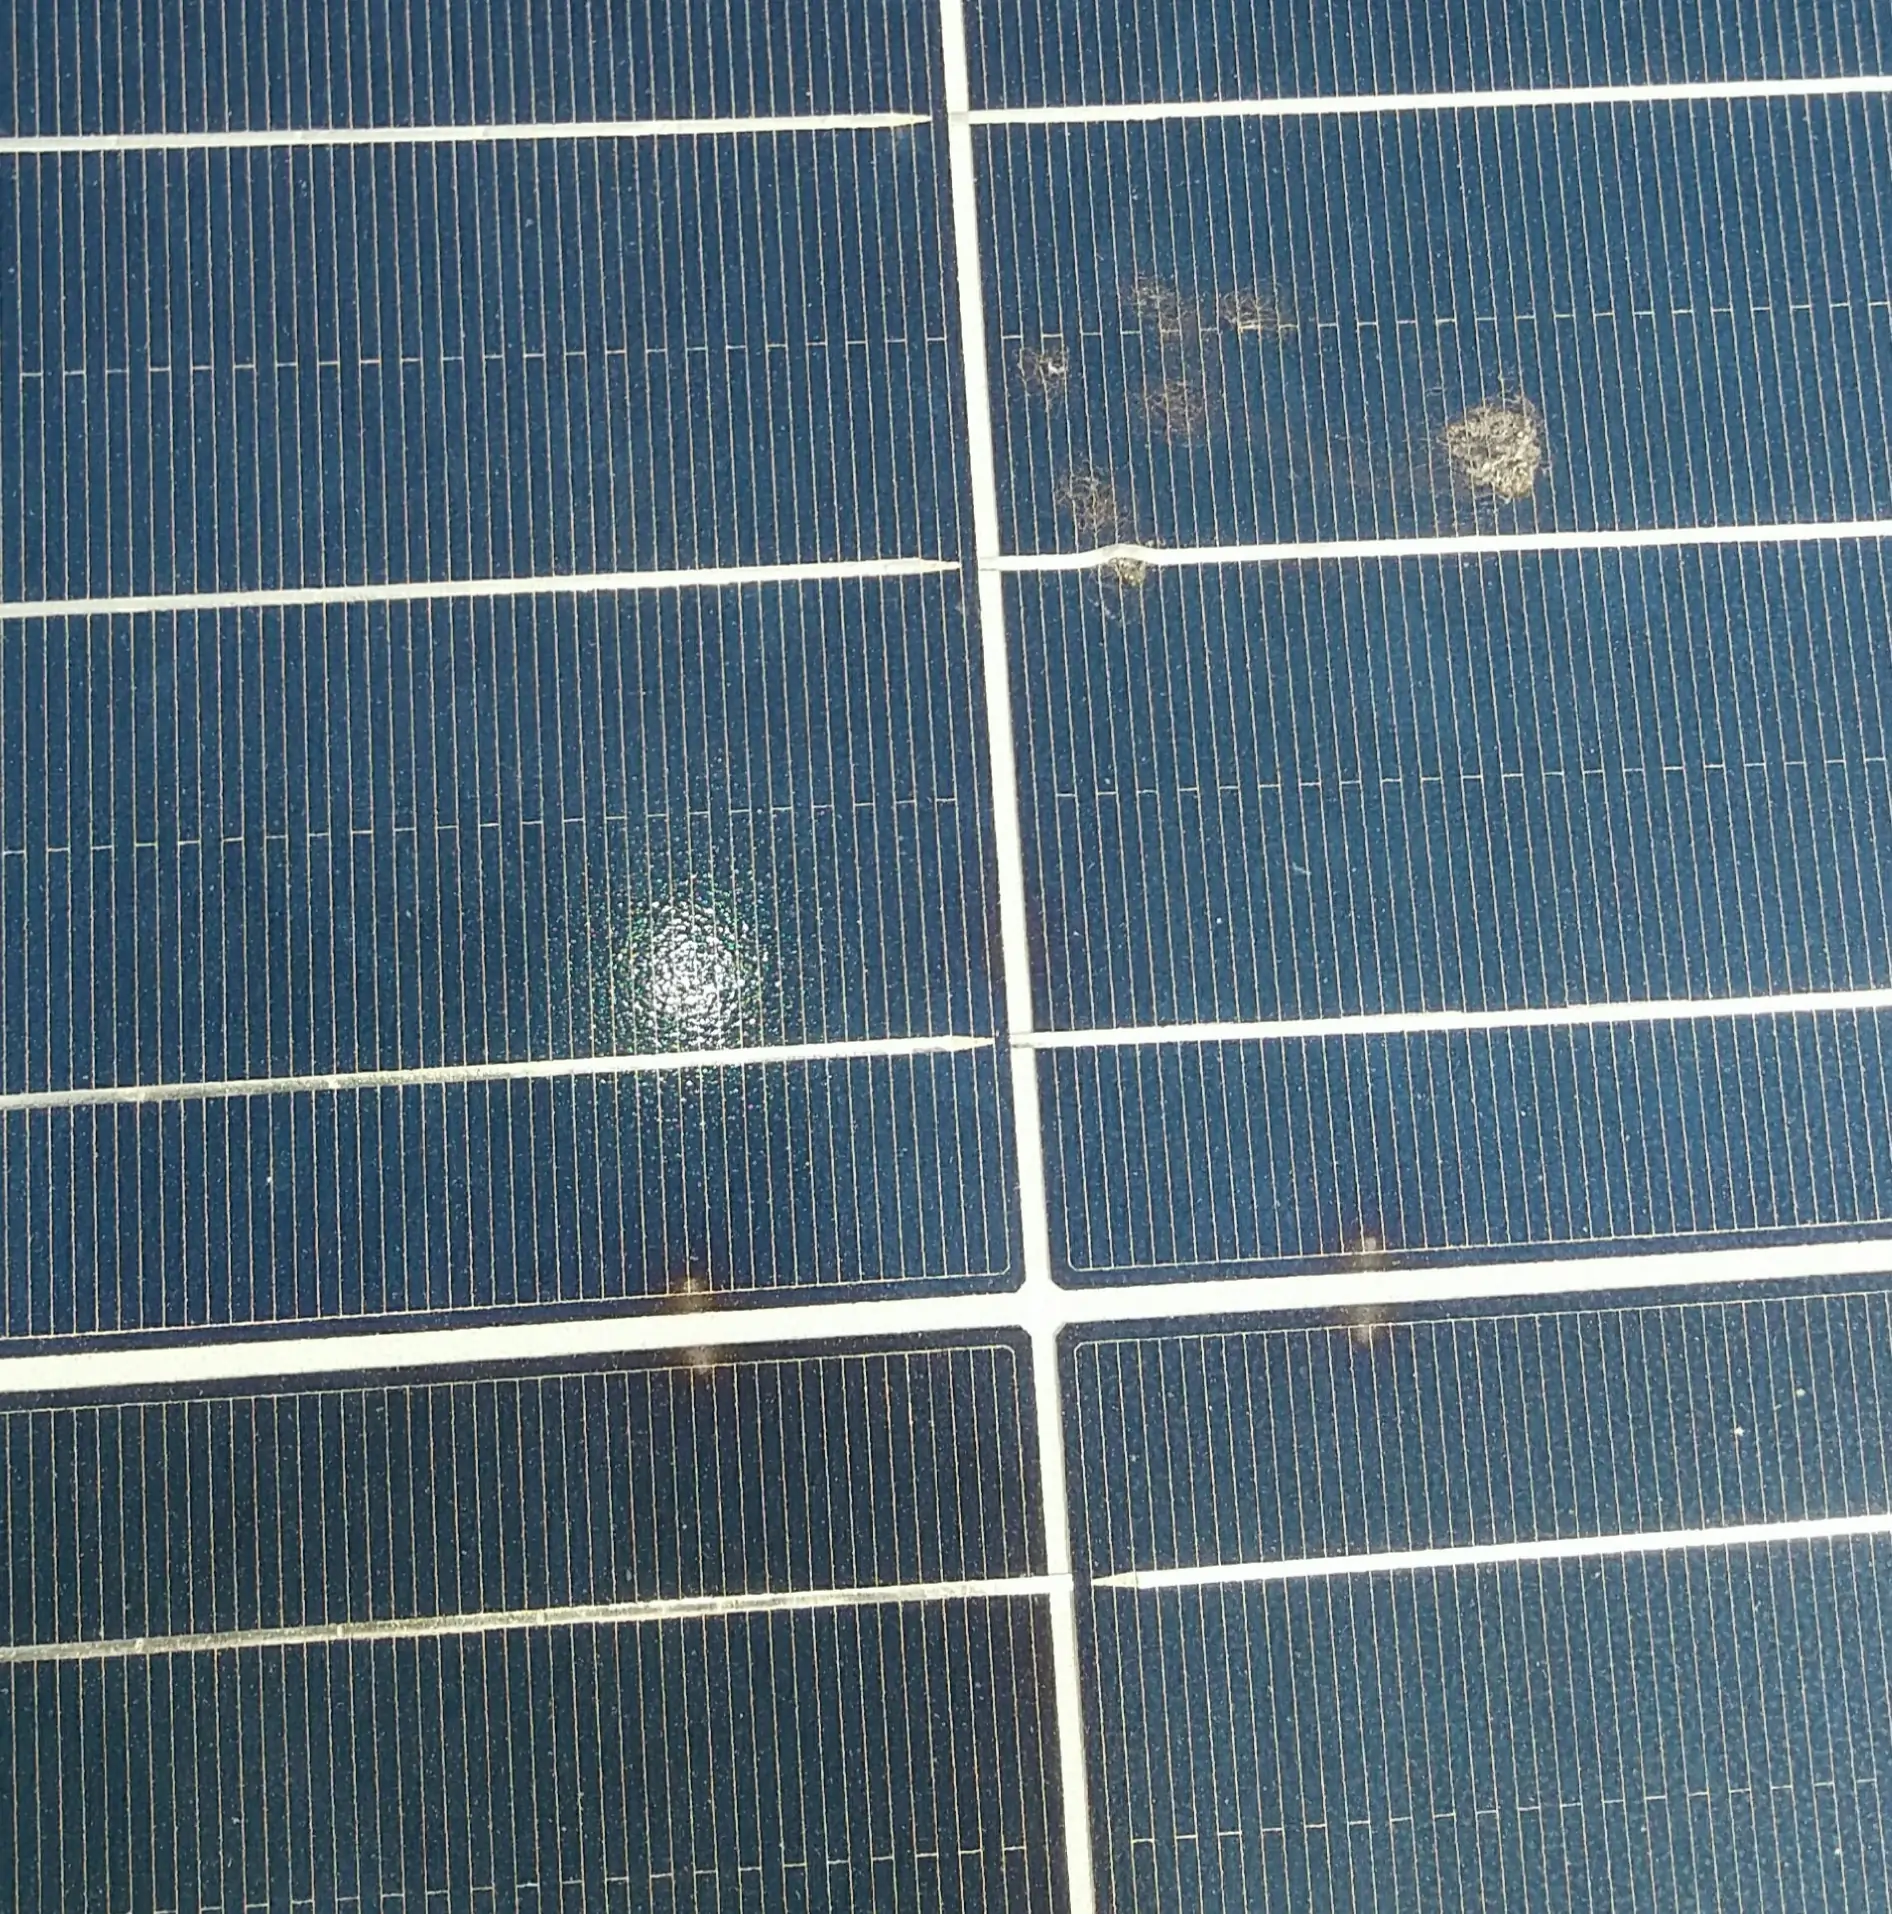
Bird droppings have a large electrical impact relative to the area they cover. A single opaque dropping blocks irradiance from reaching part of a cell. If the affected cells cannot sustain the string current, the module's bypass diode conducts and routes current around the affected cell group.
The exact effect depends on module architecture. A conventional 60- or 72-cell full-cell module has three bypass diodes protecting three groups of cells, so a bypassed group removes roughly one-third of that module's voltage contribution. Most modern utility-scale modules are larger — often 144 half-cut cells, frequently bifacial — and their substrings are wired in two parallel halves. That makes them more tolerant of a small localised shade: when a shaded cell is driven into reverse bias, its bypass diode can still bypass the protected cell group, but the unaffected parallel half can continue to contribute current. The resulting module-level power loss can therefore be smaller than for an equivalent full-cell module, though how much smaller depends on the internal wiring, the shade pattern and the operating point. In every case the contamination covers only a few square centimetres while the electrical effect can extend to an entire cell group, and a persistently shaded cell can also heat up and form a hot spot. This disproportionate impact makes bird droppings a higher cleaning priority than an equivalent area of uniform dust, particularly when string monitoring shows isolated low-performing strings near areas with bird activity.
Bird droppings also dry into a hard, cemented residue within hours. Standard rainfall and dry brushing do not remove them. Left untreated, the residue stains the glass, traps further dust, and becomes progressively harder to remove, so treat droppings as a targeted-cleaning item rather than waiting for the next full wash.
Mineral Deposits from Hard Water and Irrigation Overspray
Irrigation overspray from crops adjacent to ground-mounted plants deposits hard water droplets on module surfaces that dry and leave calcium carbonate and magnesium salt residues. Repeated exposure gradually increases the buildup. The same effect occurs during wet cleaning when hard borewell or hard municipal water is used without treatment. Each cleaning cycle adds a mineral layer. Over time, this accumulation impairs transmittance and becomes increasingly difficult to remove with water alone.
This loss develops slowly, but it affects O&M decisions: if untreated hard water is your standard cleaning method — particularly without a final rinse or wipe-down — the mineral film builds with every cycle and your baseline post-cleaning PR will drift down over the years independently of the soiling rate.
Agricultural and Industrial Dust
Dust from ploughing, harvesting, unpaved access roads, cement plants, and similar sources often carries surface adhesion — organic matter, waxy crop residues, particles with high electrostatic charge. This type of soiling does not slide off with wind or light rain. It requires wet cleaning with adequate contact pressure. During peak agricultural activity near your site, soiling accumulates faster than normal background dust deposition.
How Soiling Appears in Your Performance Data
Soiling often leaves a consistent pattern in 15-minute interval and daily SCADA data. Identifying this pattern helps separate soiling losses from other loss categories in your PR analysis and determine whether cleaning is justified.
The Accumulation and Recovery Pattern
PR declines gradually over days or weeks during a dry period. The decline is smooth and progressive, not stepped. No fault events, no alarms, no SCADA anomalies. Every inverter section shows similar declining performance simultaneously, which points strongly to soiling rather than a localised inverter fault or string-level issue.
A significant rainfall event partially or fully reverses the decline. PR recovers, then starts declining again if dry conditions resume. This sawtooth pattern across multiple rain cycles is one of the clearest soiling patterns in your historical data. If your monthly PR reports show periodic dips that align with dry spells and recoveries that align with rainfall records, soiling is the primary explanation.
Distinguishing Soiling from Shading
Shading follows the sun's position. It produces PR suppression during specific daytime windows — typically at low solar elevation angles in the early morning, late afternoon, or winter months. Your 15-minute interval data shows the dip at predictable times on predictable calendar periods.
Soiling is present throughout the generation period. The PR suppression is consistent across all hours of the day, not concentrated in a time window. Plotting intra-day power against POA irradiance on clear days makes the difference visible: Soiling appears as lower power across the day, not a time-specific dip. For a detailed treatment of shading signatures in 15-minute SCADA data, see the article on PV module shading in utility-scale solar plants.
Distinguishing Soiling from Degradation
Module degradation follows a slow, irreversible trend measured over months to years, while soiling reverses with cleaning. The practical way to separate the two is to clean a sample of modules and compare before/after performance using paired DC power and irradiance readings. If performance recovers substantially, the cause was soiling; if it remains below the earlier level, the residual gap is a non-recoverable component — degradation, coating wear, or mineral deposits that cleaning no longer removes — and warrants separate investigation.
Soiling in Temperature-Corrected PR
Soiling losses remain visible in temperature-corrected PR. Temperature correction removes the thermal derating effect caused by elevated cell temperatures above the 25°C STC reference. Soiling is an irradiance loss, not a thermal effect, so it persists in temperature-corrected PR as well as standard PR — which is exactly what lets you tell soiling apart from thermal derating.
A declining temperature-corrected PR trend during a dry period, with no concurrent equipment faults or grid issues, is a reliable indicator of soiling accumulation. Use the Temperature Corrected PR calculator to separate thermal effects from soiling before deciding on a cleaning schedule. For more background on which PR formulation fits your analysis context, see Which Performance Ratio Should You Use?
How Soiling Affects CUF and Specific Yield
Performance Ratio normalises out irradiance — PR = EAC ÷ [ PSTC × (HPOA / Gref) ], so what is left is a measure of losses, and soiling appears in it in almost direct proportion. CUF normalises nothing. CUF = energy delivered over the period ÷ (rated capacity × hours in the period), the PV equivalent of a conventional plant's Plant Load Factor. With no irradiance term, CUF moves with the weather and with every loss category at once: availability, grid curtailment, thermal derating, DC and inverter losses, and soiling.
Soiling's effect on CUF is proportional, not additive. If contamination reduces generation by a relative fraction s, then CUFsoiled = CUFclean × (1 − s). Soiling reduces CUF by the same percentage as the energy loss — not by that many percentage points. A plant running at 18% CUF with a 3% soiling loss sits at 18% × 0.97 ≈ 17.5%, a fall of roughly 0.5 percentage points, not 3. Reading a 3% soiling loss as a three-point CUF loss overstates the impact about six-fold, which is the most common error in soiling reporting.
The same proportional logic applies to specific yield (kWh/kWp): a 3% soiling loss removes about 3% of the baseline specific yield, so the absolute loss depends on that baseline — a site at 4 kWh/kWp/day loses roughly 0.12 kWh/kWp/day. Two cautions follow. First, a CUF or specific-yield decline never proves soiling on its own, because every other loss moves these metrics too. Attribute the gap by comparing insolation-corrected figures between periods — use the Degradation & Insolation Corrected CUF tool alongside the CUF / PLF calculator — and by reading the soiling line in the PR loss breakdown. For how CUF is defined, how it differs from PLF, and how the insolation and degradation corrections work, see Conventional CUF explained, CUF vs PLF and Degradation & Insolation Corrected CUF. Second, when converting a soiling loss into a CUF or specific-yield impact for a month or a year, use the period-average soiling loss, not the peak value measured just before a clean, because each cleaning event resets the accumulation mid-period.
Finally, state your capacity basis explicitly. CUF is only comparable when the energy and the capacity refer to the same boundary, for example contracted AC capacity with energy measured at the delivery point, as used in most Indian PPAs. A CUF computed on DC MWp is not comparable with a contractual AC-based CUF, and specific yield (kWh/kWp) is a different metric again — energy divided by DC capacity with no period-hours divisor.
When Should You Clean?
Many utility-scale plants operate on a fixed cleaning schedule, such as weekly, fortnightly, or monthly, regardless of what the performance data shows. During the monsoon, this leads to unnecessary cleaning of modules that rainfall has already cleaned. During dry post-monsoon and summer periods, soiling accumulates faster than a fixed schedule allows for. Neither outcome serves plant economics well.
A data-driven approach starts by measuring the actual soiling loss before scheduling cleaning. The soiling loss calculator takes pre-clean and post-clean DC power and irradiance samples from representative inverter sections and returns the absolute efficiency difference. Run it before each cycle to test whether the measured loss justifies the cleaning cost.
Industry Threshold
A 3–5% soiling loss is a widely used rule of thumb to flag a cleaning need, but it is not a fixed standard. For context, the 2022 IEA-PVPS Task 13 report (T13-21:2022) estimates that soiling accounts for roughly 3–5% of annual global PV energy loss, and stresses that the figure varies enormously by region and site. That estimate is a global average, not a prescribed cleaning trigger. In practice the trigger should be economic — clean when the value of the energy you recover exceeds the cost and risk of cleaning — which depends on your PPA tariff, cleaning cost per event, water availability, and your site's measured soiling rate.
The Economic Calculation
At a 10 MWp plant with a specific yield of 4 kWh/kWp per day and a soiling accumulation rate of 0.2% per day, the plant reaches 3% soiling loss in approximately 15 days without rainfall.
At 3% soiling loss, the daily energy loss is: 10,000 kWp × 0.03 × 4 kWh/kWp = 1,200 kWh per day. At a PPA tariff of ₹3/kWh, that is ₹3,600 per day in lost revenue at peak soiling.
Be careful with the break-even arithmetic. Soiling loss grows from zero after each clean, so the average loss over a clean-to-3% cycle is about half the peak, roughly 600 kWh/day, or about ₹1,800/day in this example. That average is the cost of not having cleaned over the cycle — it is not the benefit of cleaning now. The payback question compares two futures: the energy you recover by cleaning on a given date against the energy you would still generate by delaying the clean, over the remaining cycle, valued at your tariff. A full-plant wet wash typically costs from a few thousand rupees per MW upward depending on layout, method, and team rates. Cleaning pays back when (energy recovered by cleaning now − energy recovered by delaying) × tariff exceeds the cost of the clean.
This calculation shifts significantly with plant size, local soiling rate, and PPA tariff. Published Indian field studies put the daily rate broadly between 0.15 and 0.5 percent, with a widely cited Western India study measuring 0.37 ± 0.09 percent per day (Valerino et al., 2020). A site in a high-dust zone with 0.5% per day soiling accumulation reaches 3% in 6 days, and the cleaning economics change entirely.
Cleaning Impact Data from a Utility-Scale Plant
A structured cleaning operation at a utility-scale solar plant compared normalised generation across inverter sections as they were progressively cleaned, over a 9-day period. The plant had 10 inverters with a total DC capacity of approximately 10.76 MWp.
Each inverter section was connected to a separate group of modules. A single daily energy figure was logged for each of the ten inverters and normalised to that inverter's own DC capacity (kWh/MWp), so sections of different size could be compared directly. The reference used was the mean normalised yield of the inverter sections not yet cleaned on that day. The daily energy increment is a modelled estimate of the gain from the sections cleaned up to and including that day, with contributions attributed by time since cleaning.
| Campaign Day | Modules Cleaned | % of Plant Modules | Plant Generation (kWh) | Energy Increment (kWh) | % Energy Increment |
|---|---|---|---|---|---|
| Day 1 (11 Jan) | 1,200 | 2.9% | 27,623 | 70.8 | 0.26% |
| Day 2 (12 Jan) | 3,480 | 8.4% | 36,915 | 200.7 | 0.54% |
| Day 3 (13 Jan) | 4,800 | 11.5% | 36,414 | 321.0 | 0.88% |
| Day 4 (14 Jan) | 5,480 | 13.2% | 38,505 | 356.8 | 0.93% |
| Day 5 (15 Jan) | 1,048 | 2.5% | 41,226 | 525.9 | 1.28% |
| Day 6 (16 Jan) | 1,400 | 3.4% | 35,211 | 473.8 | 1.35% |
| Day 7 (17 Jan) | 3,112 | 7.5% | 33,581 | 443.6 | 1.32% |
| Day 8 (18 Jan) | 2,832 | 6.8% | 37,891 | 336.2 | 0.89% |
| Day 9 (19 Jan) | 2,736 | 6.6% | 42,128 | 506.0 | 1.20% |
| Campaign Total | 26,088 | 62.8% | 329,494 | 3,235 | 0.98% — campaign aggregate ÷ total generation |
Methodology note: the Energy Increment is a modelled estimate built against the inverter sections not yet cleaned on each day, and it carries the contribution of earlier cleaning days forward. The reference pool also shrinks as the campaign progresses — from nine uncleaned sections on Day 1 to a single section by Day 9 — so the later daily estimates rest on a much thinner comparison. The daily figures are therefore not independent observations and the campaign total is a sum of modelled daily estimates, so treat it as an indicative estimate of the cleaning benefit rather than a strictly causal measurement of energy recovered. A strictly causal figure requires comparing cleaned sections against sections that remained uncleaned throughout the window (a matched-control, difference-in-differences approach); the underlying per-inverter generation and cleaning dates support that stricter analysis.
The daily energy increment did not rise steadily, because it reflects the changing mix of recently cleaned sections against the not-yet-cleaned reference. It began at 70.8 kWh (0.26% of generation) on Day 1 and peaked at 525.9 kWh on Day 5 — the highest absolute increment of the campaign, even though Day 5 cleaned the fewest modules. As a share of plant generation it was highest on Days 5–7 (1.28–1.35%). It then fell to 336.2 kWh (0.89%) on Day 8 and recovered to 506.0 kWh (1.20%) on Day 9 as further sections were washed. Day 5 peaks because, in the model, every section cleaned on Days 1–4 is still contributing a gain relative to the reference, and the increment sums across all of them.
By the end of the operation, 62.8% of the modules had been cleaned. The increment is modest in absolute terms because the campaign ran in winter, when lower irradiance and some seasonal rainfall limit soiling accumulation. The same site in the dry post-monsoon period, when soiling builds faster, would show a larger increment. Across all nine days the campaign total was 3,235 kWh — an indicative, not-yet-cleaned-section-referenced figure rather than a strictly causal measurement of energy recovered (see the methodology note above).
Cleaning Techniques for Utility-Scale Plants
The cleaning method you choose affects cost, water consumption, cleaning quality, and long-term module surface condition. Each approach has real trade-offs, and the right combination depends on your site layout, water availability, contamination types, and the size of the plant.
Manual Dry Brush Cleaning
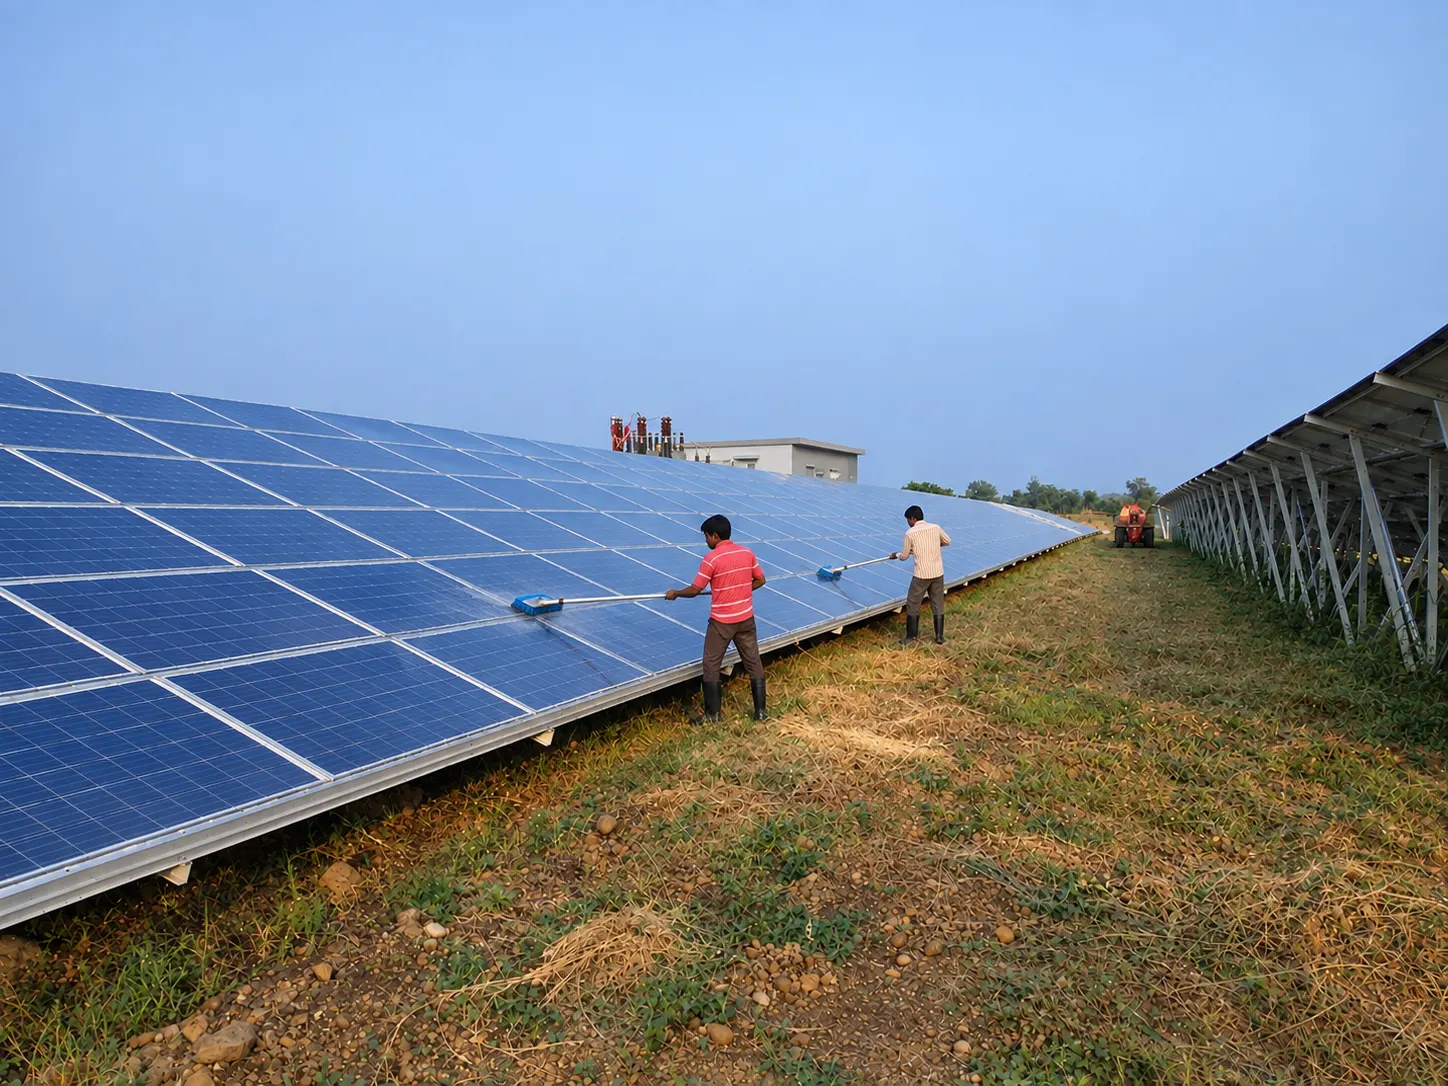
Workers use long-handled soft-bristle brushes to sweep dust from the module surface. This works for loose, dry dust. It is most effective in the early morning when dust has settled but dew has not yet wetted the surface, once dew activates, dry brushing smears dust rather than removing it. (Wet cleaning is the opposite case: there, dew helps by pre-softening adhered dust.)
Dry brushing requires no water supply infrastructure and moves quickly across rows. The cost per MW cleaned is low. For large ground-mounted plants, organised teams cover one to two MW per crew per morning depending on row width, brush width, and inter-row access.
The risk that accumulates over time is micro-abrasion. Repeated brush contact degrades the anti-reflective (AR) coating on module glass. That coating lowers surface reflectance and typically recovers a few percent of incident light, so permanently damaging it is a real, unrecoverable loss. Plants that rely exclusively on dry brushing with unsuitable brushes or excessive pressure over several years can develop a baseline PR shortfall that cleaning no longer reverses — not because the modules are dirty, but because the glass surface itself is impaired. Inspect module surfaces under direct light at an angle after extended periods of dry-only cleaning to check for fine abrasion patterns.
Dry brushing also generates a dust cloud that partially settles on adjacent rows, reducing the net yield of each cleaning pass.
Manual Wet Cleaning
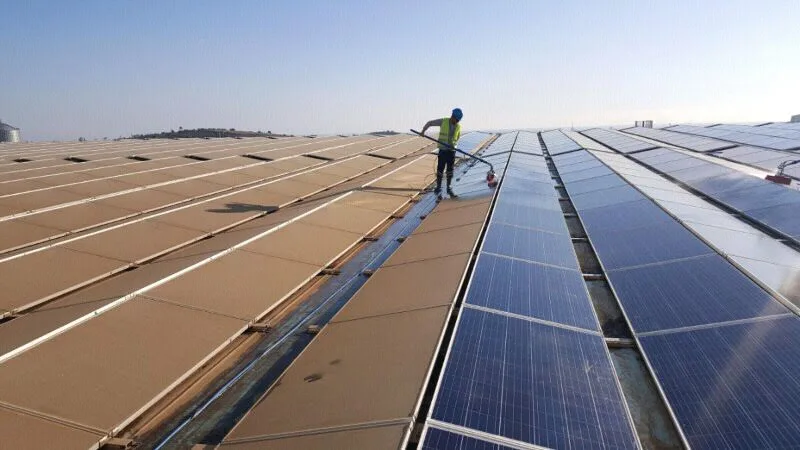
Water applied with a soft mop, microfiber brush, or low-pressure supply removes more contamination types than dry brushing. Wet cleaning addresses most adhered deposits that dry brushing leaves behind, including light bird droppings, agricultural dust with surface adhesion, and general dry-season grime.
Water quality is not a secondary consideration. Hard borewell or municipal water deposits calcium and magnesium carbonate on the glass with every cleaning cycle. Repeated use of hard water progressively builds mineral films that impair transmittance. Where soft water, collected rainwater, or treated/demineralized water is available, use it. Where only hard water is available, account for the long-term mineral accumulation in your baseline performance expectations.
Module temperature at cleaning time affects both safety and result quality. Cleaning at peak irradiance hours, when glass surface temperatures can exceed 50°C in summer, is discouraged by most module manufacturers and can stress the glass through rapid temperature change; it also causes fast evaporation that leaves mineral residue before the surface is wiped clean. Early morning cleaning avoids both problems: glass temperature is lower, irradiance is low, and morning dew pre-softens adhered dust.
Vehicle-Supported and Mechanized Cleaning
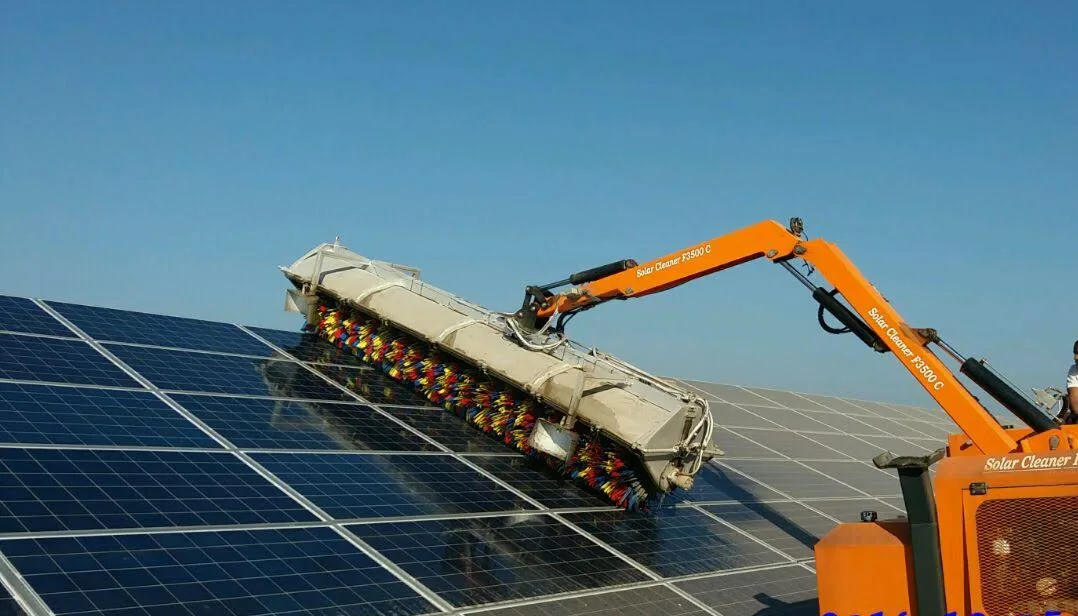
Vehicle-mounted rotating brush systems clean at throughputs that manual methods cannot match. For plants above 10 MW, mechanized cleaning is usually the only practically scalable approach to completing a full site clean within a short operational window. This matters most during the transition from monsoon to dry season, when you want to complete a full plant clean quickly before soiling accumulates again.
Brush type, rotation speed, contact pressure, and water delivery rate all affect both cleaning effectiveness and module glass condition. Stiff brushes at high contact pressure remove more contamination but accelerate AR coating wear. Soft brushes at low pressure protect the glass but leave adhered deposits. Operating parameters need to be validated against module surface inspection and post-cleaning performance data, not set once at commissioning and forgotten.
Water consumption for mechanized wet cleaning at a 30 MW plant is substantial. Plan supply logistics before each cleaning event, particularly at sites where borewell capacity is limited or water use restrictions apply seasonally.
Post-Cleaning Verification: Did the Cleaning Work?
Cleaning is not complete until you confirm that performance recovered. The most common O&M error is logging the cleaning work without checking whether the performance gap closed afterward.
Skipping post-cleaning verification creates two problems. First, you don't know whether the cleaning was effective. Second, if PR does not recover to the pre-soiling level, you have no data to distinguish incomplete cleaning from an underlying module performance loss that was present before cleaning.
Before and After Performance Sampling
Take instantaneous DC power and irradiance readings on representative inverter sections before cleaning, then repeat them on the same sections after cleaning under similar irradiance conditions. The soiling loss calculator returns the absolute efficiency difference between the two sets.
Taking multiple paired samples across several representative sections improves reliability by averaging out short-term irradiance and temperature variation. The tool requires DC power (kW) and irradiance (W/m²) readings, which your SCADA logs at every 15-minute interval if your monitoring is configured correctly. Take post-cleaning samples within 24–48 hours of the event, before fresh soiling accumulates and compresses the measured gain.
When PR Does Not Recover
If post-cleaning efficiency doesn't return to the pre-soiling level, four causes account for most cases:
- Incomplete coverage. Modules in areas that are difficult to access, such as near mounting structures and row ends, were not reached. Walk through the cleaned sections and inspect the module surfaces before recording the cleaning work as complete.
- Persistent contamination. Hardened bird droppings, mineral deposits, or dried agricultural residue remained on the module surface after cleaning. These deposits require targeted scrubbing or a longer wet contact time than a standard cleaning pass provides.
- AR coating damage. Repeated cleaning with unsuitable brushes or excessive pressure damages the anti-reflective coating on module glass. Coating damage reduces light transmission and creates a persistent optical loss that normal cleaning does not restore. Inspect the glass surface for fine scratches, abrasion marks, or visible changes in surface appearance.
- Underlying module degradation revealed. Soiling hides existing module degradation, microcracks, or delamination in performance data. After cleaning, the module output remains below the earlier clean-state level because the module has an underlying performance loss. EL (electroluminescence) imaging of affected modules or strings helps identify defects such as inactive cell areas, cracks, and other cell-level damage.
The Soiling Analysis tool gives you the efficiency gap. The field investigation tells you which of these causes explains it.
Soiling Loss in Monthly Performance Reports
In a monthly PR loss breakdown, soiling is classified as an irradiance-related loss. Soiling reduces EAC by reducing the irradiance reaching the PV cells through the module glass. Soiling and shading affect the plant differently over time and across different plant areas, but both are classified as irradiance-related losses in the loss breakdown.
Report soiling loss separately from:
- Thermal losses (cell temperature above the 25°C STC reference)
- DC wiring and cable losses
- Inverter efficiency losses
- Availability losses from equipment downtime
- Grid curtailment losses
A soiling loss entry in your monthly MIS report needs three elements: the measured or estimated soiling loss percentage for the period, the methodology used to determine it (before/after paired sampling, PR trend analysis, or soiling station measurement), and the corresponding energy loss in kWh.
If direct soiling measurements are not available, record the cleaning dates, the number of modules cleaned during each event, and any PR recovery observed after cleaning. This record supports cleaning schedule decisions in following months and provides supporting data for PPA compliance reporting and lender performance reviews.
Use the Plant and Grid Generation Loss tool to calculate and record the energy loss caused by soiling for each reporting period. Use the CUF calculator alongside your PR calculator to track how soiling affects both generation efficiency and capacity utilisation in your monthly reports. For a detailed explanation of how string-level monitoring helps identify soiling differences between module groups, especially when contamination is uneven across the array, see String-Level Monitoring vs Plant-Level Monitoring.
Frequently Asked Questions
- How do you tell soiling loss apart from module degradation in PR data?
- Soiling reverses with cleaning. Degradation does not. If PR drops during a dry period and recovers substantially after a cleaning event, the cause is soiling. If PR remains below the earlier clean-state level after cleaning, the remaining loss requires further investigation for module degradation, anti-reflective coating damage, or mineral deposits. Comparing performance before and after cleaning across multiple cleaning cycles helps determine whether the remaining loss persists after soiling is removed.
- Why does PR sometimes stay low after wet cleaning?
- Four causes account for most cases: modules in hard-to-reach areas were missed, hardened contamination survived the cleaning pass, the anti-reflective coating on the glass is damaged, or an underlying module defect such as microcracks or delamination is now visible. Use the Soiling Analysis tool with before-and-after paired samples from selected inverter sections to measure the performance recovery after cleaning.
- What soiling rate per day should be assumed for utility-scale plants in India?
- Published Indian field studies report daily soiling rates that vary widely by site and season, broadly 0.15 to 0.5 percent per day during the dry post-monsoon and summer periods, with dusty inland sites at the higher end. A widely cited Western India field study measured about 0.37 percent per day (Valerino et al., 2020). Agricultural zones near active farmland exceed this during ploughing and harvesting seasons, and the monsoon resets soiling substantially for most sites. Measure your site's actual rate using before/after performance comparison rather than applying a generic default.
- Does rainfall clean solar panels adequately for utility-scale plants?
- Light rainfall does not. It removes some loose dust but often leaves adhered contamination such as bird droppings, agricultural dust, and dried mineral deposits. Heavy, sustained rainfall significantly reduces soiling loss and delays the next cleaning event by days to weeks depending on site conditions. Most utility-scale plants in India require active cleaning during the dry season even when intermittent showers occur.
- How often should a utility-scale solar plant be cleaned?
- Cleaning frequency should be determined by measured soiling loss and economics, not a fixed calendar. A 3 to 5 percent soiling loss is a common rule-of-thumb trigger, but the defensible trigger is economic: clean when the value of the energy recovered exceeds the cost and risk of cleaning. At a soiling rate of 0.2 percent per day, a site reaches 3 percent loss in approximately 15 days without rainfall. The threshold depends on the PPA tariff, cleaning cost per event, water availability, and plant layout.