Degradation & Insolation Corrected CUF
Degradation & Insolation Corrected CUF adjusts the conventional CUF to represent the plant’s capacity utilization as if the PV modules were operating at their rated, non-degraded capacity and under expected solar irradiance conditions.
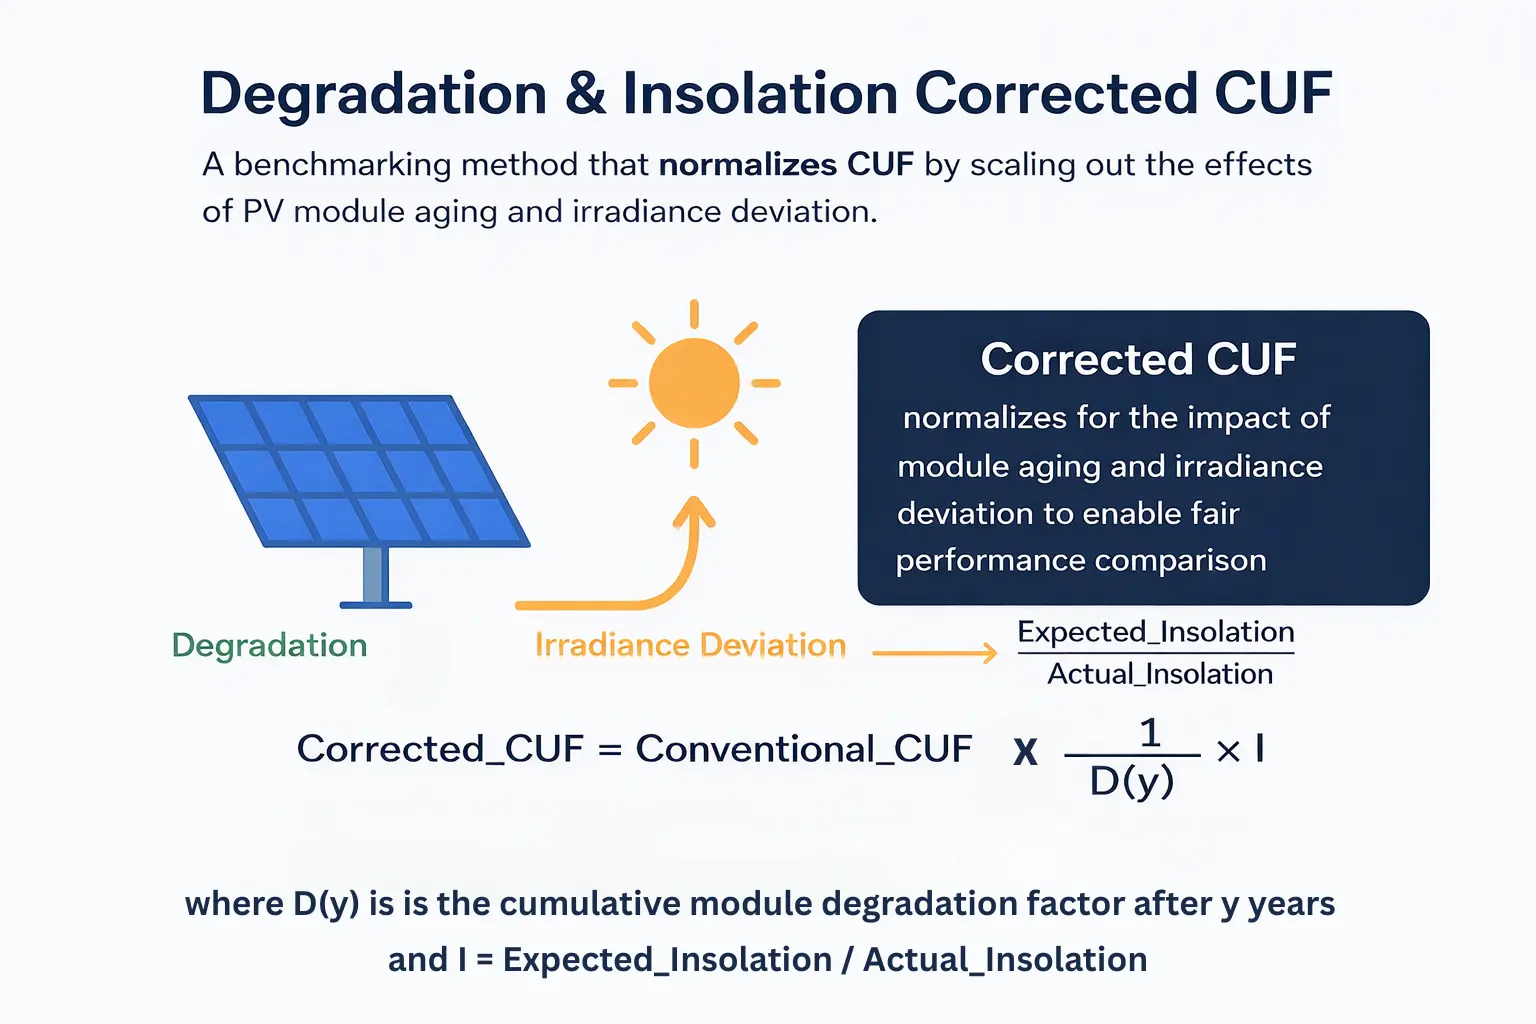
A simple and practical method to analyze operational solar performance by normalizing for module aging and irradiance variability, allowing fair comparison across months, years, and locations without altering other physical loss mechanisms.
Have you ever compared a five-year-old solar power plant that had a cloudy year with a brand-new solar power plant in perfect sun?
Of course the older plant looks worse but that doesn’t mean it’s failing. Degradation & Insolation Corrected CUF fixes that. It removes panel aging and odd sunlight factors so you see the plant’s real performance.
What Is Degradation & Insolation Corrected CUF?
Conventional Capacity Utilization Factor (CUF) is the ratio of actual energy generated to the theoretical maximum (rated capacity × hours) during a period. Corrected CUF scales this value to normalize (1) module degradation and (2) deviation between actual and expected insolation. The result is a fair baseline for performance comparisons across time and locations. In simple words, this method acts like a solar CUF normalization tool— as it strips out the effects of aging and unusual sunlight so you can clearly see how well the plant is actually being operated.
Degradation & Insolation Corrected CUF Formula (Practical Form)
Conventional_CUF = Energy_actual / (P_rated × Hours)
Degradation factor at age y: D(y) = (1 − d)y
where d = annual degradation rate (e.g., 0.8% = 0.008)
Insolation correction factor (POA): I = Expected_Insolation / Actual_Insolation
Corrected_CUF = Conventional_CUF × (1 / D(y)) × I
This formulation assumes a constant annual degradation rate. First-year degradation is intentionally smoothed into the annual rate to avoid discontinuities in long-term benchmarking. Use the same assumption consistently across comparisons.
Important clarification: Measured energy already includes the impact of module degradation. This correction mathematically removes aging effects only for normalization. It does not change actual energy or losses. The goal is fair comparison, not performance inflation.
Corrected CUF Calculator – What It Does
When we look at a solar plant's Capacity Utilization Factor (CUF), the number often goes up or down due to factors that are not under operational control: PV module aging and irradiance variability.
1. Normalizes for the impact of module degradation
As modules get older, their output naturally drops. This natural decline makes older plants look under-performing even when they run fine. The calculator brings the CUF back to the level the plant would show if the modules were still new.
2. Normalizes for actual vs expected insolation
A cloudy month or low-irradiance month can reduce CUF even if the plant operated correctly. The calculator corrects the CUF by comparing the sunlight you expected with the sunlight you actually received.
Data quality caution: Soiled or misaligned POA sensors can under-report actual irradiance. This may artificially increase corrected CUF. Always validate sensor cleanliness and calibration.
3. Helps evaluate performance trends correctly
By removing aging and irradiance variations, the trend you see actually reflects plant operation.
4. Simple inputs, practical output
Energy, capacity, hours, age, degradation rate, actual and expected insolation—that’s all the calculator needs to show both conventional and Degradation & Insolation corrected CUF.
Who should use Corrected CUF?
- O&M teams who need fair month-to-month comparisons should use it.
- Asset managers benchmarking sites across regions should use it.
- Auditors and technical analysts who want to separate weather and aging from controllable losses will find it useful.
Limitations and cautions
- Corrected CUF removes weather and age effects but does not remove curtailment or grid outages unless excluded explicitly.
- It depends on the quality of insolation data.
- Degradation assumptions matter: wrong assumptions will bias comparisons.
- Use contract values (e.g., PPA) for compliance, not corrected CUF.
- Temperature-related losses are not normalized. Seasonal temperature effects remain part of operational performance. Corrected CUF should not be expected to align with temperature-corrected PR.
Methodology and Assumptions
This corrected CUF methodology is intended for performance benchmarking and internal analysis. It assumes a constant annual module degradation rate, reliable plane-of-array irradiance data (measured or well-validated), and consistent capacity definitions across the analysis period. This metric does not replace contractual performance indicators such as PPA CUF, PR guarantees, or availability clauses.
Results should be interpreted as a relative benchmarking metric rather than an absolute performance guarantee.
This methodology assumes DC rated capacity unless explicitly stated otherwise. Do not mix AC energy with DC capacity. Use consistent definitions across all periods.
Conventional CUF vs Corrected CUF
Both metrics matter. They answer different questions. Use the one that fits your goal.
| Point | Conventional CUF | Corrected CUF |
|---|---|---|
| What it shows | Raw output | Normalized for weather and aging |
| Good for | PPA compliance | O&M benchmarking |
| Low sun | Drops strongly | Adjusted baseline |
| Degradation | Reduces CUF | Neutralized |
| Users | EPCs, investors | O&M teams, auditors |
If you want true trend → Use Degradation & Insolation corrected CUF. For contracts → Use conventional CUF.
Worked Example — annual
These realistic values can be used in the calculator.
| Input | Value |
|---|---|
| Energy (year) | 1,680,000 kWh |
| Plant capacity | 1,000 kW |
| Hours | 8,760 h (365days) |
| Age | 4 years |
| Degradation (d) | 0.8% |
| Expected insolation | 2,000 kWh/m² |
| Actual insolation | 1,900 kWh/m² |
Step-by-step
- Conventional CUF = 19.18%
- D(4) ≈ 0.968
- I ≈ 1.0526
- Corrected CUF ≈ 20.86%
Corrected CUF ≈ 20.9% under the stated degradation and insolation assumptions. Use this value for fair relative benchmarking.
Typical Degradation Rates for Common PV Modules
Industry-average values compiled and regularly updated in 2024–2025.
| Module Technology | First-Year Degradation | Annual Degradation (after year 1) |
|---|---|---|
| Mono PERC | 2.0–3.0% | 0.55%/yr |
| TOPCon | 1.0–2.0% | 0.40%/yr |
| Heterojunction (HJT) | ≤1.0% | 0.30%/yr |
| Thin Film (CdTe/a-Si) | 0.8–1.0% | 0.80%/yr |
| Bifacial (cell-technology dependent) | ~1.0-1.5% | 0.40–0.55%/yr |
Source: Compiled from NREL PV Fleet Performance Reports, Fraunhofer ISE Photovoltaics Report 2024, and latest manufacturer warranty sheets (Longi, Jinko, Trina, First Solar, REC, etc.). Values represent typical warranted or median observed rates as of 2025.
Always use module-specific warranted values for contractual purposes and measured field data for performance audits.
Common Mistakes When Calculating Corrected CUF
- Using GHI (Global Horizontal Irradiance) instead of POA (Plane of Array).
- Inconsistent handling of first-year versus long-term module degradation.
- Mixing different insolation datasets without conversion
- Using AC energy with DC capacity.
- Not excluding curtailment or grid outages before calculating CUF.
Fix these for accurate corrected CUF.
Best Practices for Using Corrected CUF
- Be consistent with periods : Compare month-to-month or year-to-year, not a mix.
- Track soiling & downtime : Degradation & Insolation Corrected CUF doesn’t excuse controllable losses—use it to flag them.
- Keep degradation realistic : Typical values often range ~0.5%–1%/year; use your module’s warranted rate if known.
- Use reliable insolation data : Site sensors (POA) preferred.
- Use same comparison period.
- Document degradation assumptions.
- Track soiling/downtime separately.
- Match AC/DC correctly.
Frequently Asked Questions
What is Degradation & Insolation Corrected CUF?
Degradation & Insolation Corrected CUF is a normalized capacity utilization metric that adjusts conventional CUF for PV module aging and deviations between expected and actual insolation, enabling fair performance benchmarking.
How is corrected CUF different from conventional CUF?
Conventional CUF reflects raw energy output relative to rated capacity and hours, while corrected CUF normalizes the value for module degradation and irradiance variability to support fair comparison across time and locations.
Does a higher CUF always mean better plant performance?
No. CUF can increase due to higher solar irradiance or longer effective irradiance hours, even if the plant is experiencing losses such as curtailment, inverter inefficiencies, or a poor performance ratio. CUF alone does not indicate how efficiently the system converts available solar energy into electrical output.
Ready to compute? Open the Free Calculator