Conventional Capacity Utilization Factor (CUF) is the standard metric used across solar EPC, O&M, and lender reporting to express how much energy a plant actually delivered against what its installed capacity implies over a given period. It's the number that shows up in monthly generation reports, PPA compliance checks, and lender monitoring — not a design estimate, a measured outcome.
This guide covers how CUF is calculated, what actually moves it up or down, and what benchmark ranges look like across different regions and mounting types. If you need to run the number for your own plant, our CUF/PLF calculator does the math directly.
What You'll Find in This Guide
This article is the first step in our comprehensive series on CUF — the Conventional Capacity Utilization Factor used to measure the actual performance of a solar plant against the energy implied by its installed capacity over time.
- What CUF really means and how it impacts your solar yield.
- Why monitoring CUF matters, whether you manage a utility-scale project or a small residential system.
- How to calculate CUF accurately, with clear examples and easy-to-follow formulas.
- Practical tips to improve your plant’s CUF and get more from your solar setup.
What CUF Really Means and How It Impacts Your Solar Yield
The Conventional Capacity Utilization Factor (CUF) is a key performance metric that shows how much energy a solar power plant actually generates compared to the energy implied by its installed capacity over a defined time period.
In simple terms, CUF reflects how consistently a solar plant uses its installed capacity under real operating conditions. A higher CUF means the plant is generating more energy relative to its size over time. A lower CUF indicates reduced utilization, often due to factors such as weather variation, dust and soiling, shading, grid outages, or equipment downtime.
CUF is closely related to specific yield — energy generated per kW of installed capacity (kWh/kWp) — since both are derived from the same generation and capacity inputs, just expressed differently (a percentage vs. an energy-per-kW figure). Monitoring CUF over time helps identify underperformance early. For example, a sustained drop in CUF may point to issues like inverter outages, increased soiling losses, system degradation, or seasonal reductions in solar irradiance.
Understanding CUF allows you to move beyond nameplate capacity and focus on actual, measurable energy production, making it an essential metric for evaluating real-world solar plant performance.
Why CUF matters
CUF helps you benchmark real performance across sites, technologies, and regions.
CUF is useful for O&M prioritization, contractual reports, and financial forecasting.
Everyday Analogy of CUF and PR
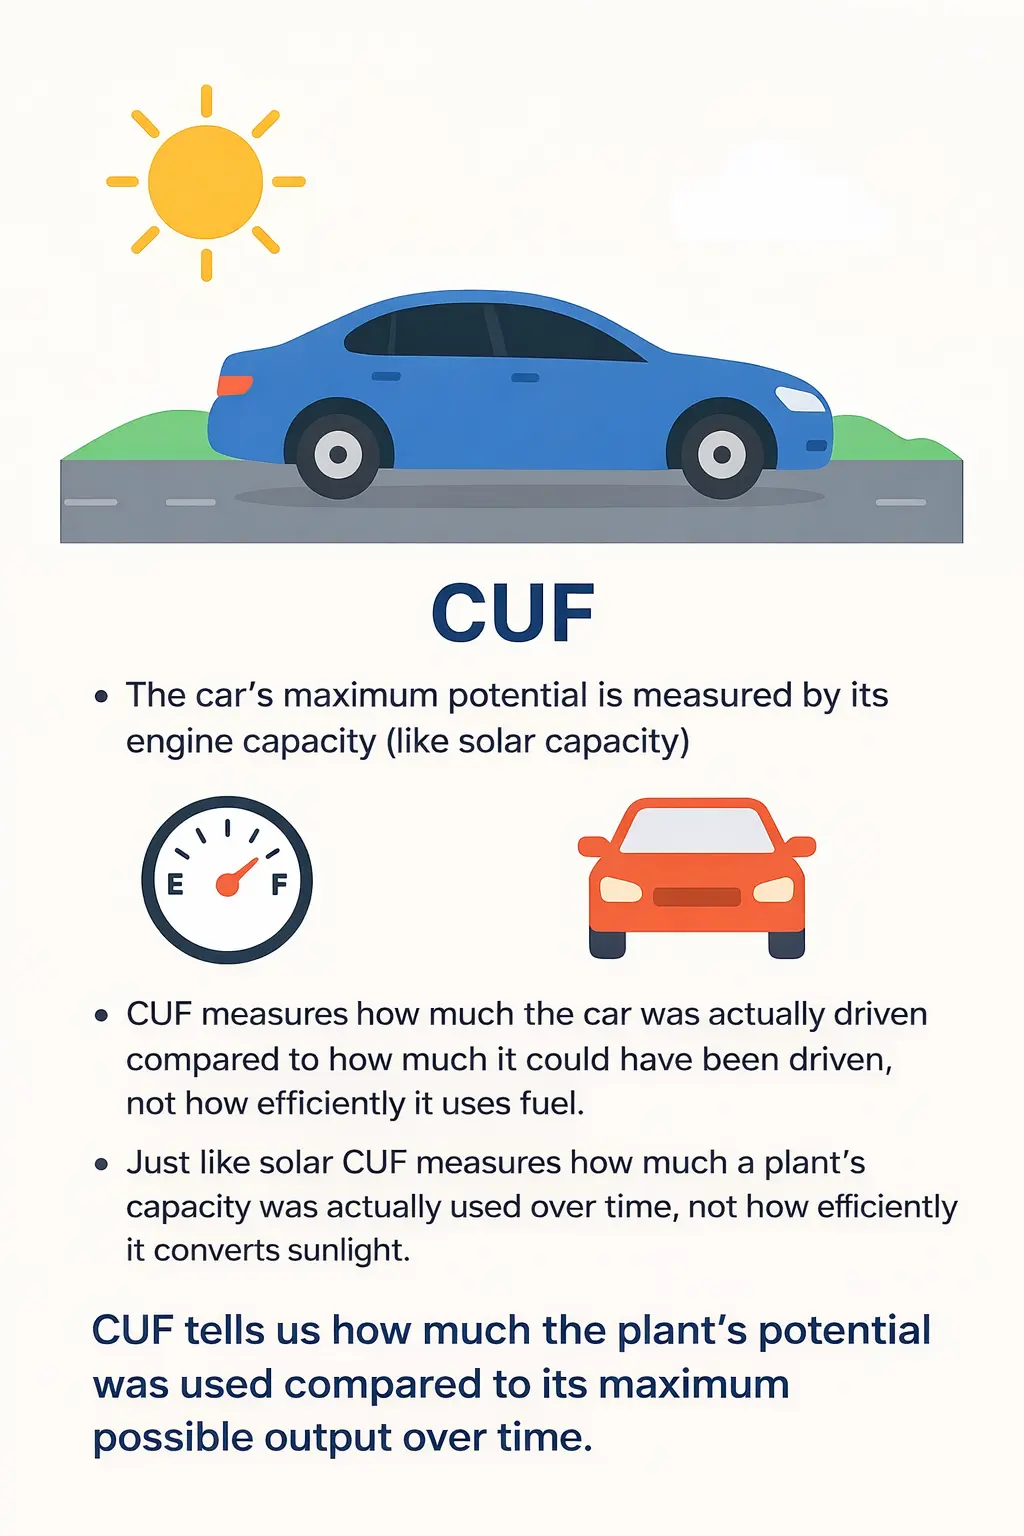
Think of a solar power plant like a car.
Engine size is like installed capacity — a bigger engine doesn't mean the car is driven at full speed all the time, and a bigger plant doesn't mean it runs at full output all the time.
CUF answers one question: what percentage of the energy corresponding to the plant's rated capacity was actually generated during a given period?
The analogy has a limit worth naming: a car could theoretically be driven around the clock, so a low CUF for a car just means it wasn't used much. A solar plant can't generate at night, and sunlight varies through the day — so even a perfectly maintained plant will never reach 100% CUF. A 100% CUF isn't a realistic target for solar. Typical utility-scale plants land between 15% and 30%, depending on region and technology.
CUF doesn't tell you how the plant performed relative to the solar resource it received. That's where Performance Ratio (PR) comes in. PR is a normalized performance metric that compares actual plant energy yield with the reference yield based on the solar irradiation received.It reflects the combined impact of temperature, soiling, degradation, inverter losses, mismatch, availability, and other system losses.
Factors that influence CUF:
- Sunlight hours - More sunshine, higher CUF
- Location
- Solar PV Panel direction and tilt
- Temperature - Panels are not very fond of extreme heat. If it is too hot, their efficiency drops
- Dust and maintenance - Dirty Panels = lower CUF
- System losses
Common Misconception: People often assume ‘higher CUF = better plant’, but this is not always true. A higher CUF does not necessarily mean that the system is more efficient. It only means that the system is producing more energy in a given period of time, not that it is doing it in a more efficient way. For example, high solar irradiation or reduced grid curtailment can increase CUF by increasing total energy generation, even when the plant’s Performance Ratio (PR) or conversion efficiency is relatively poor
Conventional CUF Formula and Calculation
The standard formula for Conventional CUF is:
CUF (%) = (Actual Energy Generated / (Plant Capacity × Time Period in Hours)) × 100
| Parameter | Value | Unit |
|---|---|---|
| Plant Capacity | 5 | MW |
| Plant Capacity (converted) | 5,000 | kW |
| Actual Generation | 8,760,000 | kWh |
| Time Period | 8760 | Hours |
| CUF | 20 | % |
Convert capacity to kW before applying the formula — kWh and MW don't cancel out directly (1 MW = 1,000 kW). Divide actual generation by (capacity in kW × hours), multiply by 100. This is the same calculation lenders and DISCOMs run for monthly and annual reporting.
Benefits of Using CUF for Solar Performance Optimization
- Benchmarking: Compare against global averages (15-25% for utility-scale solar).
- Issue Detection: Low CUF helps in finding issues like shading or inverter faults.
- Financial Insights: Higher CUF indicates higher energy production relative to installed capacity, though it should be interpreted alongside PR and system design.
- Integration: Combine this with our PR or Specific Yield calculators for a fuller diagnostic picture.
Tips to Improve Your Plant’s CUF
- Clean your solar panels regularly to minimize dust and shading losses.
- Check inverter performance periodically to prevent conversion inefficiencies.
- Optimize the tilt and orientation of your panels for seasonal sunlight.
- Monitor generation data frequently to detect any performance deviations early.
A Typical O&M Improvement Pattern
For illustration: a fixed-tilt plant with heavy soiling and inconsistent inverter uptime can lose several percentage points of CUF versus its design value. A disciplined cleaning schedule and inverter-availability monitoring typically recovers a meaningful share of that gap — though isolating the O&M-driven improvement from year-to-year irradiance variation requires insolation-corrected analysis, not a raw CUF comparison.
How to improve CUF
- Automate and schedule panel cleaning based on soiling rates.
- Monitor inverter availability and reduce downtime.
- Optimize tilt and layout for seasonal gains.
- Integrate CUF monitoring into SCADA or remote dashboards.
- Combine CUF with PR and specific yield for root-cause analysis.
References & Standards
Regional CUF / capacity-factor benchmarks (conservative, sourced)
The table below shows conservative, evidence-backed typical annual ranges. These are site-dependent estimates (technology, tracking, tilt, soiling, curtailment affect results).
| Region | Conservative typical range | Notes |
|---|---|---|
| India | ≈15% – 22% | Range reported in Indian planning and site studies; many utility sites commonly fall in this window. |
| Middle East (desert sites) | ≈19% – 25% | High irradiation deserts produce higher capacity factors; industry outlooks for MENA support upper-end values. |
| Europe | ≈10% – 16% | Temperate and higher-latitude sites show lower annual utilization; SolarPower Europe and IRENA reporting supports lower ranges versus desert regions. |
| USA — Southwest (best utility-scale sites) | ≈25% – 30% | Historic utility-scale capacity factors in Arizona/Utah/New Mexico have been reported near the high 20s for top projects. |
| Africa (varies by subregion) | Varies widely; high-potential desert sites ≈18% – 25% | Continent-wide averages are not robust; IRENA and regional outlooks show very high potential in some areas (Sahara/North Africa). Mark as estimated. |
Sources: Data adapted from NREL (U.S. Solar Data Explorer, 2024), MNRE (India Solar Performance Reports), IRENA Renewable Energy Statistics 2023, and SolarPower Europe Market Outlook 2024.
In India, fixed-tilt utility-scale solar plants typically achieve annual CUF values between roughly 15% and 25%, with tracking systems capable of higher values depending on site and design.
Frequently Asked Questions
What does CUF actually measure?
CUF measures how much of a solar plant's rated capacity was used, on average, over a time period — expressed as actual energy generated divided by the energy the plant would produce running at full rated output for that entire period. It reflects utilization, not conversion efficiency.
Does a higher CUF mean a better-performing plant?
No. CUF can rise from higher irradiance or reduced grid curtailment even when the plant's own conversion efficiency (PR) is unchanged or worse. A high-CUF plant in a high-irradiance region can have a lower Performance Ratio than a low-CUF plant in a weaker-irradiance region.
Why do two plants with the same capacity report different CUF?
The gap usually comes from site irradiance, mounting type (fixed-tilt vs tracker), soiling and O&M discipline, grid curtailment, and whether CUF is calculated on DC or AC capacity. A DC-basis and AC-basis CUF for the same plant can differ by 15–25% at a typical 1.2–1.3 DC:AC ratio.
What CUF range is realistic for utility-scale solar by region?
Fixed-tilt utility-scale plants typically run 15–22% in India, 19–25% in high-irradiance desert sites (Middle East/North Africa), 10–16% in Europe, and up to 25–30% at the best US Southwest sites. Actual values depend on soiling, curtailment, and system design at the specific site.
🧩 Test Yourself: How Well Do You Know CUF?
Think you’ve mastered CUF? Try this short quiz to check your understanding before exploring our CUF Calculator
Final Thoughts
CUF is one number, but it's a diagnostic starting point — track it alongside PR and irradiance data, and a sustained drop is usually worth investigating before it shows up in your generation report.
This article is reviewed periodically and updated to reflect current industry standards and reference data.