Auxiliary Power Consumption in Solar Plants: What Draws Power, Where You Meter It, and What It Does to Net Energy
Auxiliary power consumption (APC) is the electrical energy used by a solar plant's supporting equipment, including control supplies, SCADA, weather stations, lighting, CCTV and auxiliary-fed cooling systems. Some inverter-module fans draw power from the DC circuit instead. Track transformer losses separately unless the applicable contract or reporting methodology includes them in APC.
APC matters when comparing gross generation with net energy delivered at the contractual metering point. Some PPAs define guaranteed generation on a net-energy basis, but the treatment of auxiliary consumption, transformer losses, cable losses and imported energy depends on the contract and metering arrangement. Gross and net PR figures may not be directly comparable when their energy measurement boundaries differ.
The photos in this article come from ground-mounted utility-scale plants. This article covers common auxiliary loads, where to measure their consumption, how to calculate APC and net energy, and which checks to perform on monthly generation data.
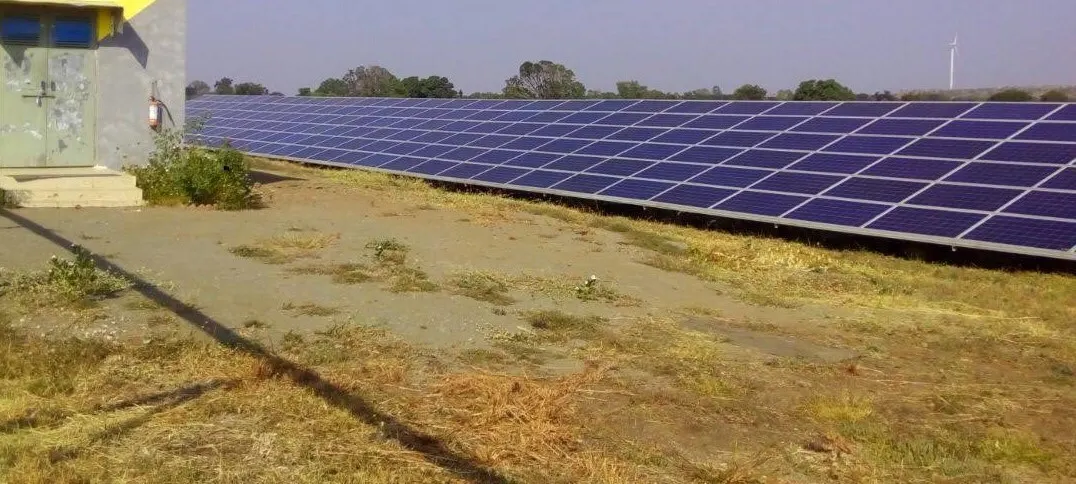
What counts as auxiliary load in a PV plant
Sort every load by how long it runs. Daytime loads vary with solar generation or ambient temperature, while round-the-clock loads continue running after sunset and contribute to the plant's night-time grid import.
| Load | Runs when | Where to get the data |
|---|---|---|
| LCL filter, cabinet door and roof cooling fans | Follows temperature and control settings, and runs at night when settings call for it | Nameplate power and operating hours. Confirm from the wiring diagram which fans the auxiliary feeder supplies. |
| Inverter module cooling fan | Daytime, follows inverter module temperature | Not auxiliary on the 630 and 1,000 kW units here. The R8i module fans take power from the DC circuit. |
| Inverter control and communication supplies | Day and night while the auxiliary feeder is closed | Inverter datasheet standby value, then a night meter reading to confirm |
| Control and auxiliary transformers | Whenever energized | Transformer nameplate and test report |
| Step-up transformer no-load loss | While energized | Factory test report at rated voltage. Your PPA decides whether this counts as auxiliary |
| Weather monitoring station and data logger | 24 hours | Sensor and logger datasheets, plus the communication power supply |
| SCADA, network switches, UPS and battery chargers | 24 hours | Equipment rating plates, then confirmed against night import |
| Room lighting, ventilation and air conditioning where fitted | Whenever temperature and control settings call for it. Lighting mainly runs at night. | Equipment ratings and operating hours. |
| Security lighting and CCTV | Night for lamps, 24 hours for cameras | Lamp power ratings and operating hours, plus camera power ratings. |
| Module cleaning pumps | During cleaning campaigns | Pump power rating and operating hours. |
One distinction matters when calculating auxiliary power consumption. Your import meter at night records auxiliary loads and the losses of transformers within its metering boundary, including no-load losses and load losses where applicable. Your PPA decides which of those counts as auxiliary. Read the clause before you split them.
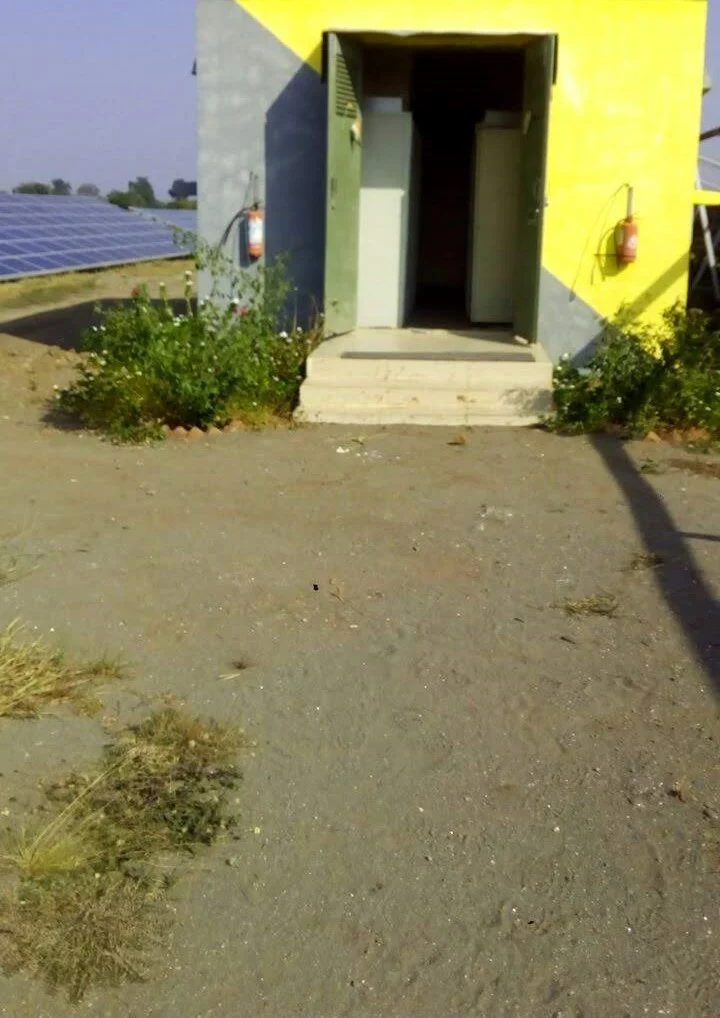
Inverter cooling fans: check which supply feeds them
Inverter fans fall into separate groups, and each group draws from a different place. The 630 and 1,000 kW units at this plant use R8i inverter modules, two per 630 kW unit and three per 1,000 kW unit. Each module has a speed-controlled fan driven at 15 to 55 Hz, and the intermediate DC circuit supplies its power. The manual leaves these module fans out of its auxiliary consumption table. Their energy leaves through the inverter and shows up as lower AC output, so the loss belongs in inverter efficiency. Counting it again in APC double-counts the loss. The LCL filter fan, the cabinet door fans and the roof fans are separate. The manual says the auxiliary voltage supply feeds the circuit boards, cooling fans and contactor controls, so confirm each fan's feed from your wiring diagram before you add it to APC.
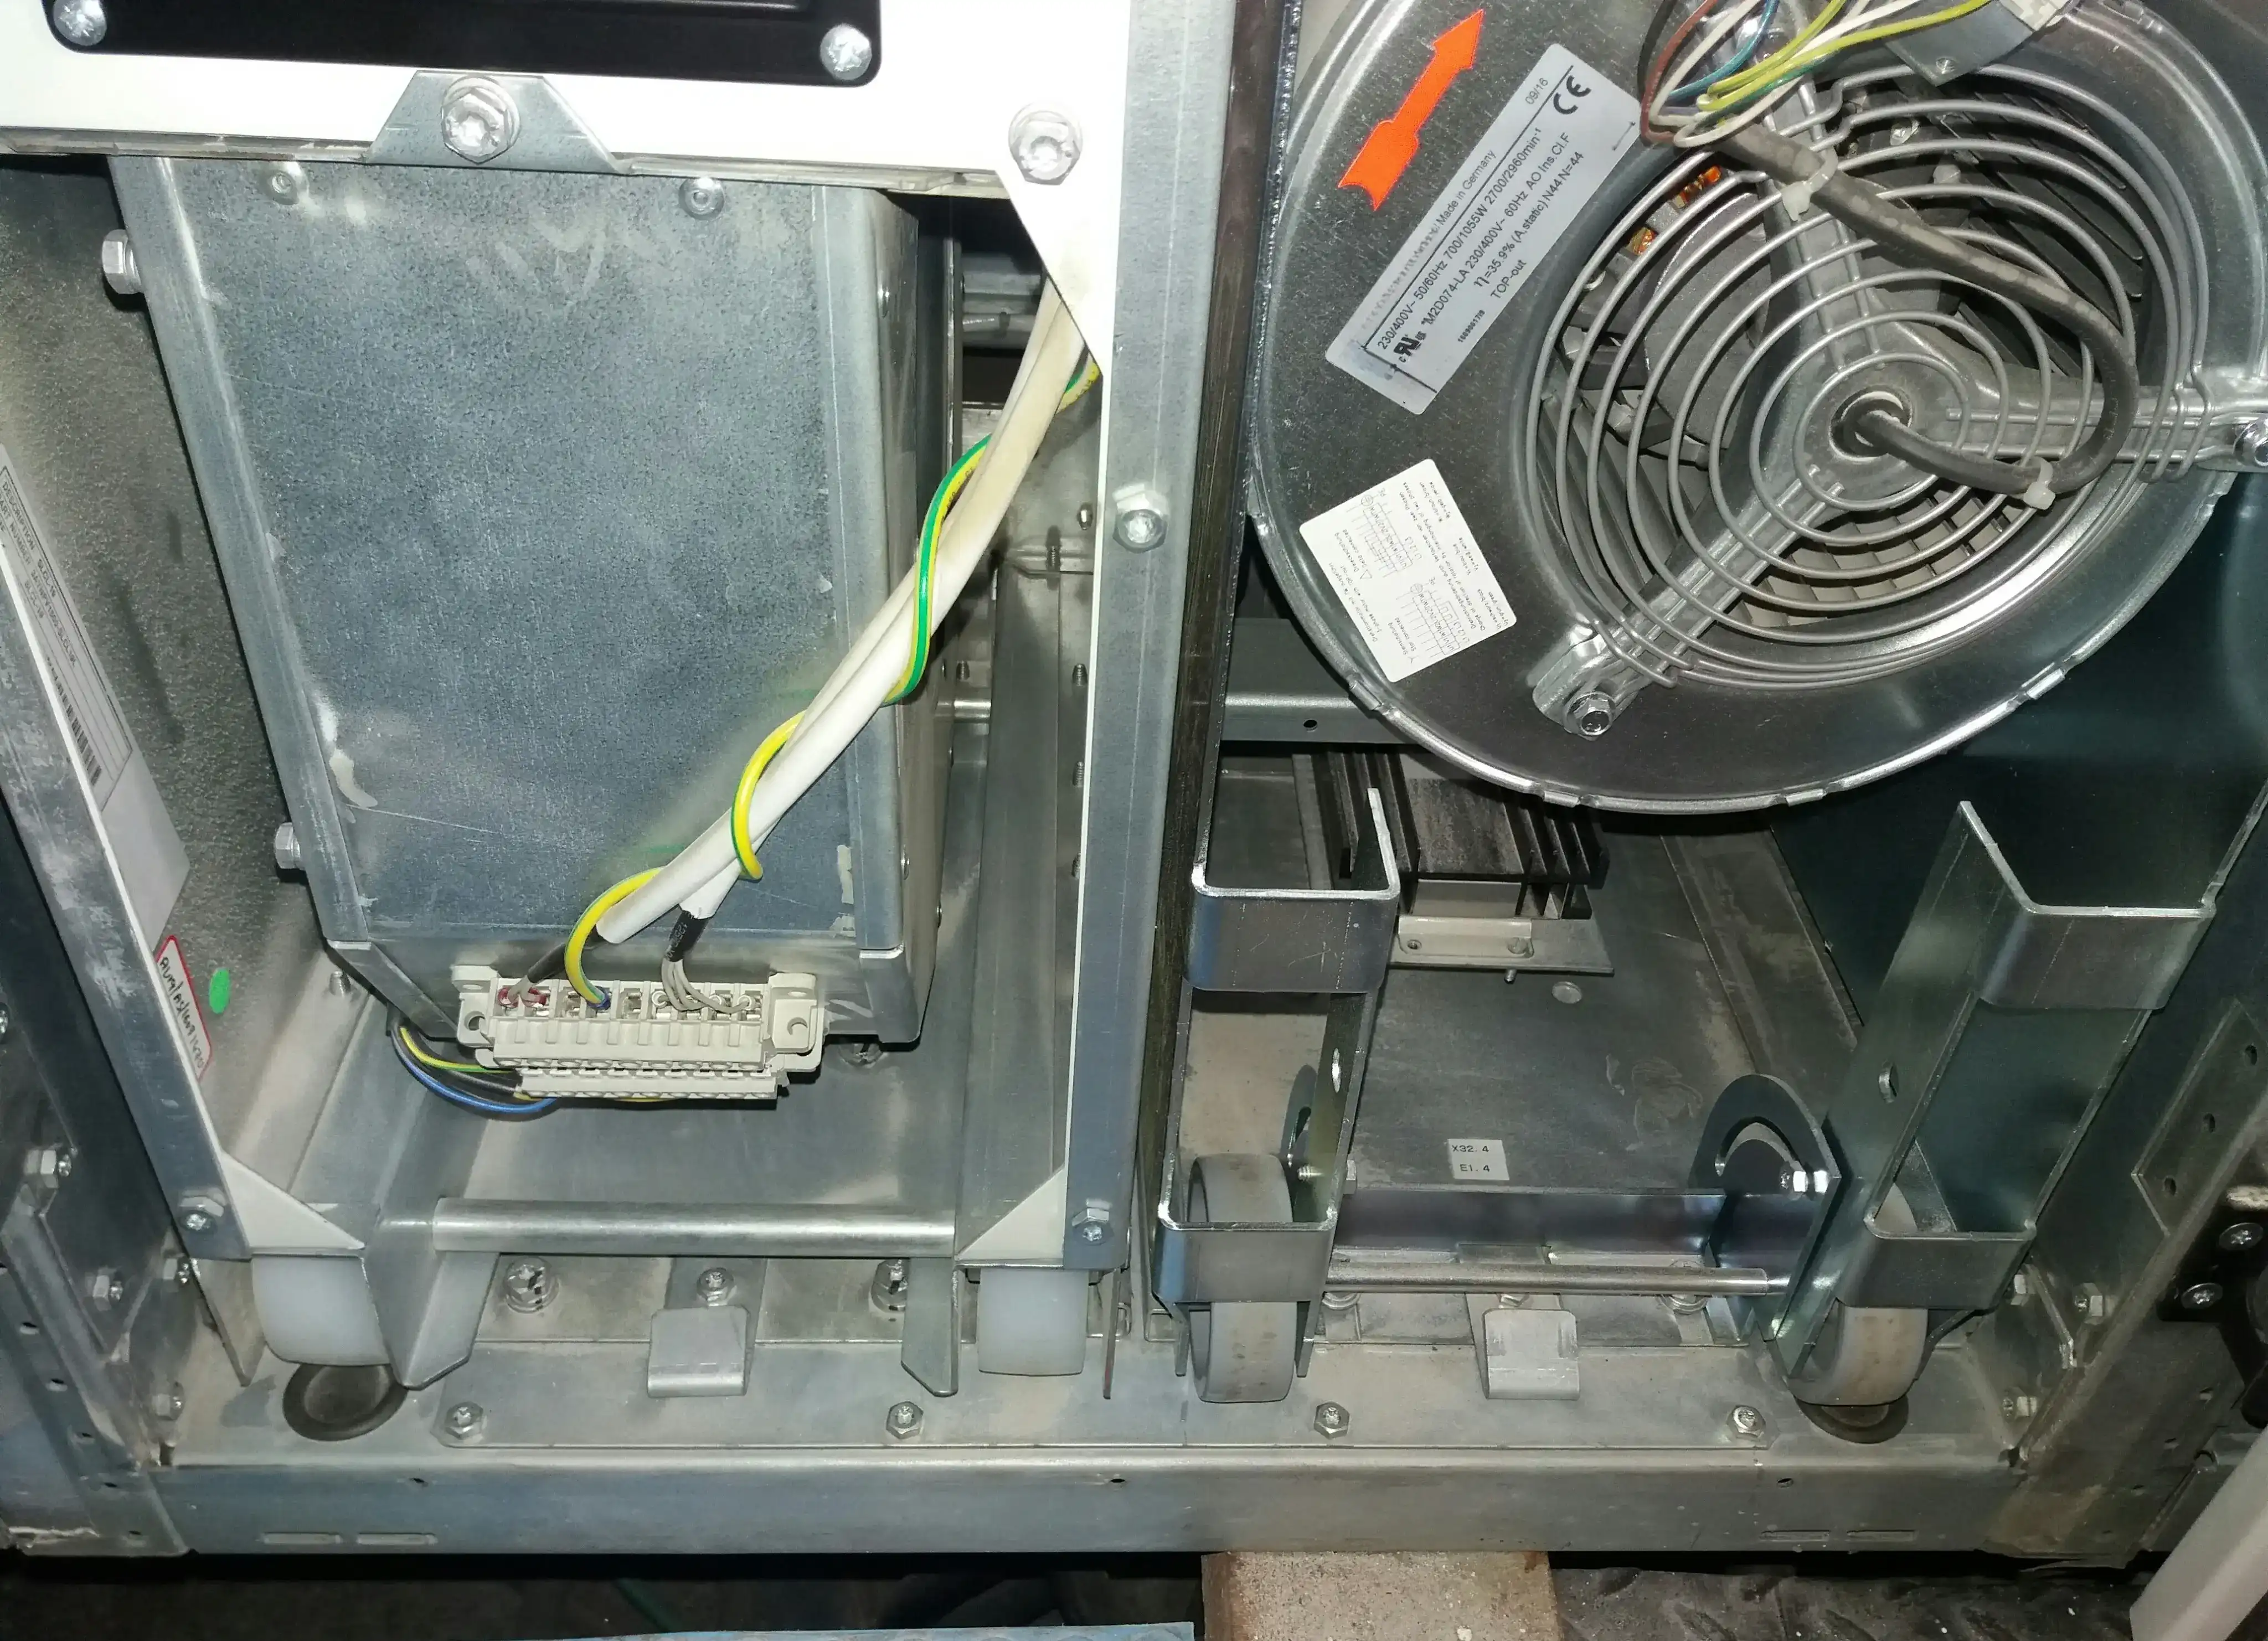
The nameplate shows a three-phase motor rated at 230/400 V, with power ratings of 700 W at 50 Hz and 1,055 W at 60 Hz, running at 2,700 and 2,960 rpm, respectively.
The fan in the photo is the LCL filter cooling fan replaced following an LCL fan fault, described in the central inverter cooling article. Its terminal block connects to the inverter's auxiliary supply. These nameplate ratings do not necessarily represent the fan's actual electrical input at its operating speed. If measured active input power is 0.70 kW for ten hours, energy consumption is 7 kWh. Measure real input power with a suitable power analyser. Do not estimate it from current alone, because power factor changes the result. Under comparable operating conditions, fan shaft power approximately follows the cube of rotational speed. At 80% rotational speed, idealised shaft power is about 51% of full-speed power.
The manufacturer's auxiliary-circuit table gives a total running consumption for the applicable inverter configuration and excludes the inverter-module cooling fans powered from the solar generator. Do not add the LCL fan's nameplate rating separately to that total unless the documentation for your exact model or your measurements show the table excludes it.
Fans supplied by the auxiliary feeder, such as the LCL filter, cabinet door and roof fans, belong in APC. Estimate their energy consumption using the nameplate rating and operating hours, then compare it with meter readings:
E_fan = P_fan (kW) × run hours × fans per inverter × number of inverters
Treat the estimate as an upper bound only if the nameplate power represents maximum electrical input. Use inverter logs for operating hours where available.
A failed fan reduces that fan's own power consumption while raising inverter temperature and the risk of thermal derating. Other fans might run faster to compensate. A fan running at full speed increases auxiliary consumption when the auxiliary feeder supplies it. A DC-powered module fan affects the inverter's DC-to-AC energy balance instead. A clogged filter restricts airflow and raises equipment temperature. Check filter condition, fan operation and temperature trends before you blame the filter for higher auxiliary consumption. Compare fan status, temperatures, operating conditions and measured consumption across inverters of the same type. For more on thermal derating and its effects on PR and CUF, see the central inverter cooling article.
The auxiliary supply inside the inverter
The next photo shows the lower section of an inverter cabinet, with a control transformer at the bottom. Above the transformer you find a mains filter, a small breaker, a surge protective device and an isolator. Three DIN-rail supply modules and a terminal rail sit higher, with another switch-mode supply in the top corner.
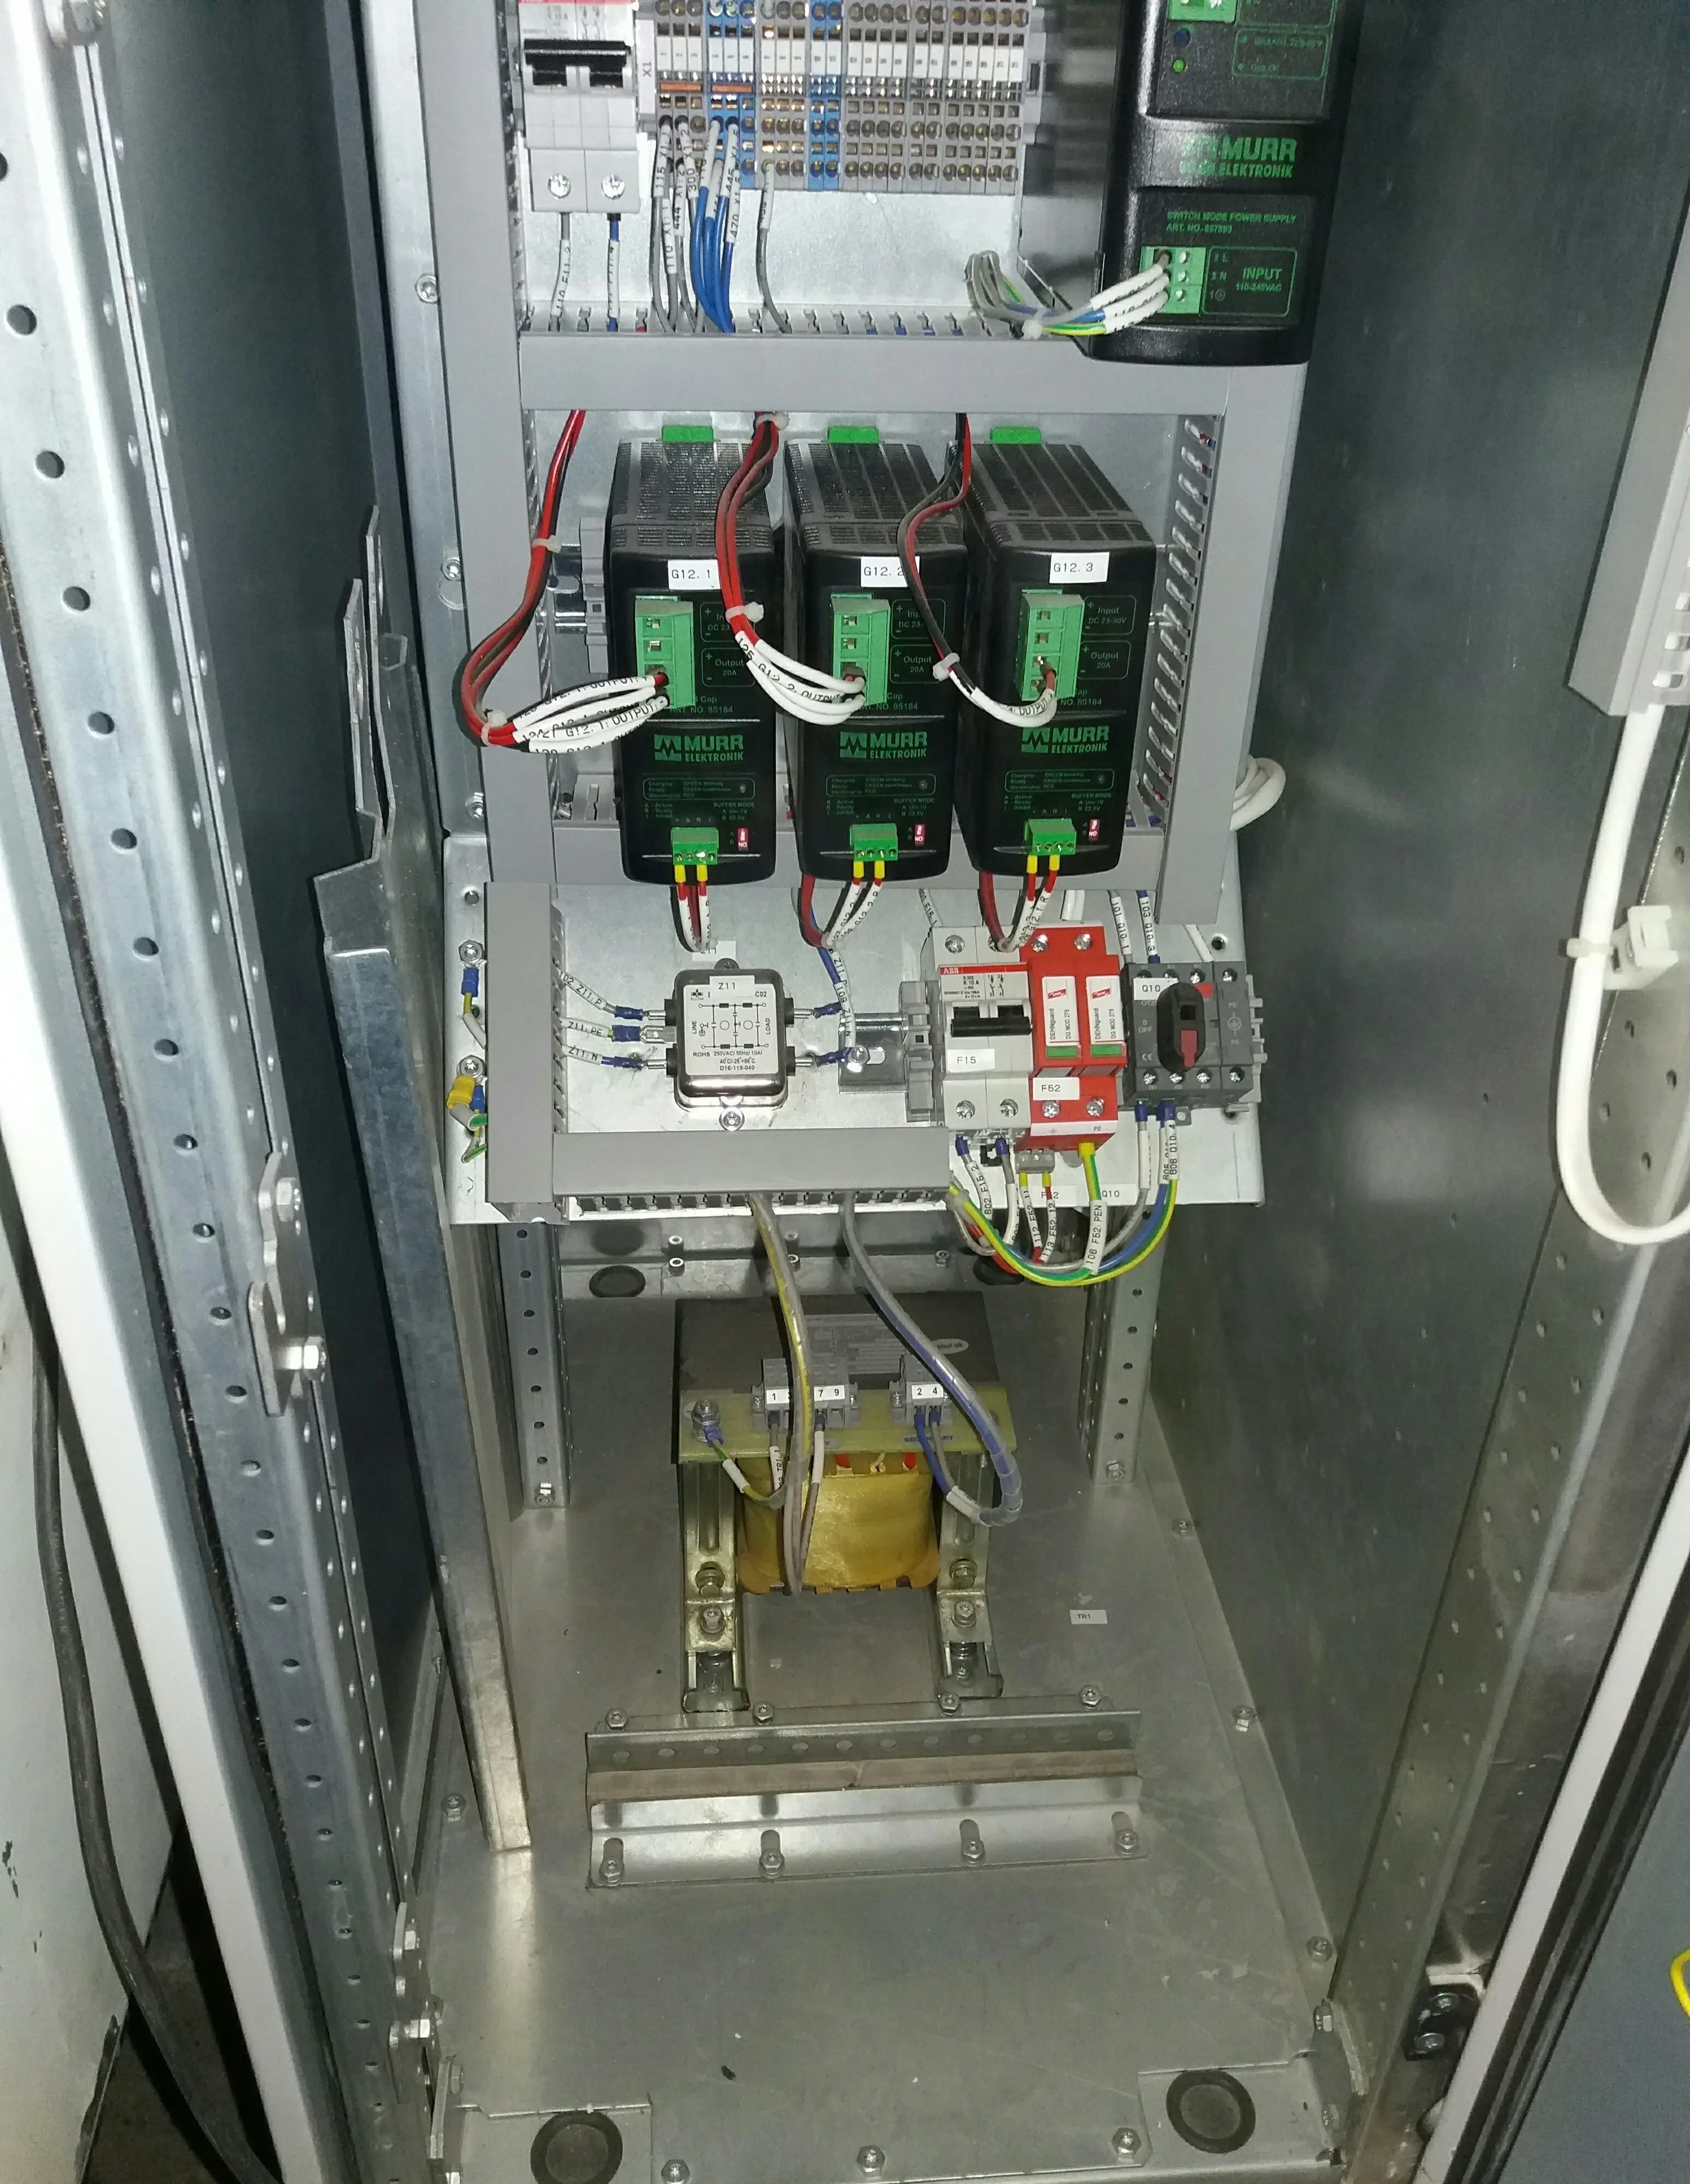
The control transformer and power-supply modules feed the inverter's control circuits and consume power while their supply stays energized, including after the PV modules stop generating. The mains filter, breaker, SPD and isolator serve filtering, protection or isolation, so do not count each as a separate auxiliary load. Across all inverters, the control supplies add to night-time import. Check the manufacturer's standby rating and compare it with measured consumption where possible.
For this inverter family, the manufacturer specifies a maximum running consumption of 680 W and standby consumption of 45 W for the 875 and 1,000 kW units. The 630 kW unit has a specified standby consumption of 70 W. A heating resistor option (+G300) adds up to 450 W in standby on the 875 and 1,000 kW units and up to 350 W on the 630 kW units, depending on temperature. For 14 inverters at 45 W and two at 70 W, the combined standby consumption is 0.77 kW, excluding any heater consumption. These figures exclude the module cooling fans. Check the inverter's equipment list or wiring diagram to confirm whether the heating resistor is installed. For surge protection across the plant, see the SPD and surge arrester article.
What your import meter reads after sunset
After sunset, PV generation stops, but the plant still draws power from the grid to supply auxiliary loads and transformer losses. A step-up transformer continues to incur no-load losses while energized, unless it is disconnected from the supply.
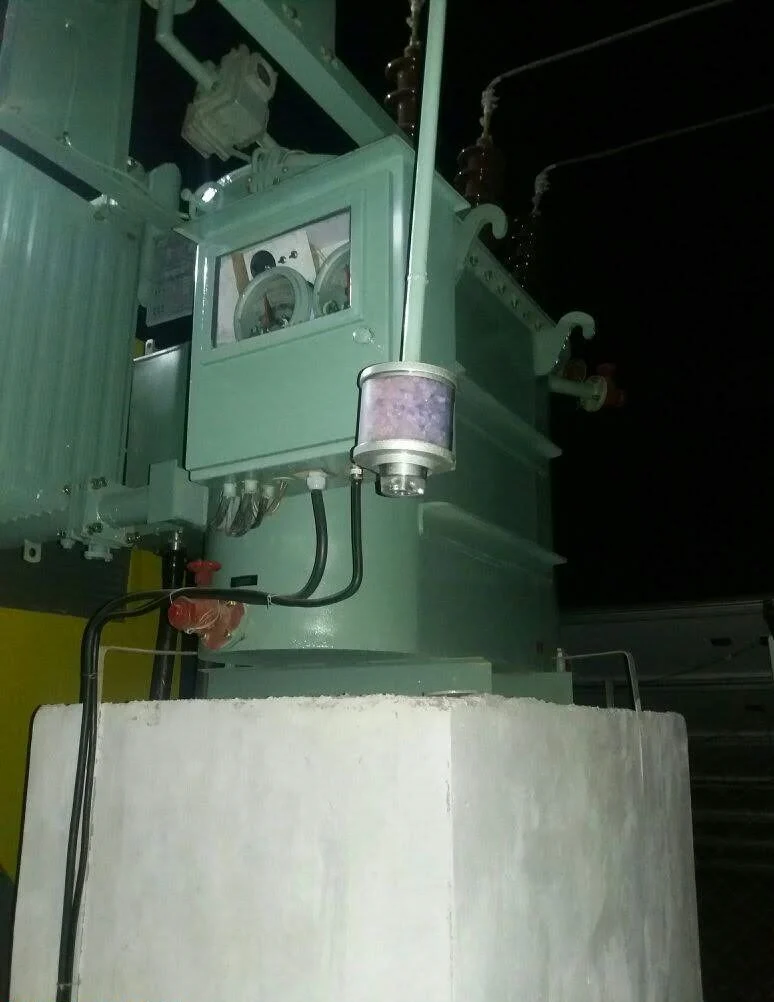
The photo below shows a transformer at night, with two dial gauges inside the marker box and a silica gel breather on the side. No-load losses continue as long as the transformer remains energized. Use the factory test report to obtain the specified no-load loss.
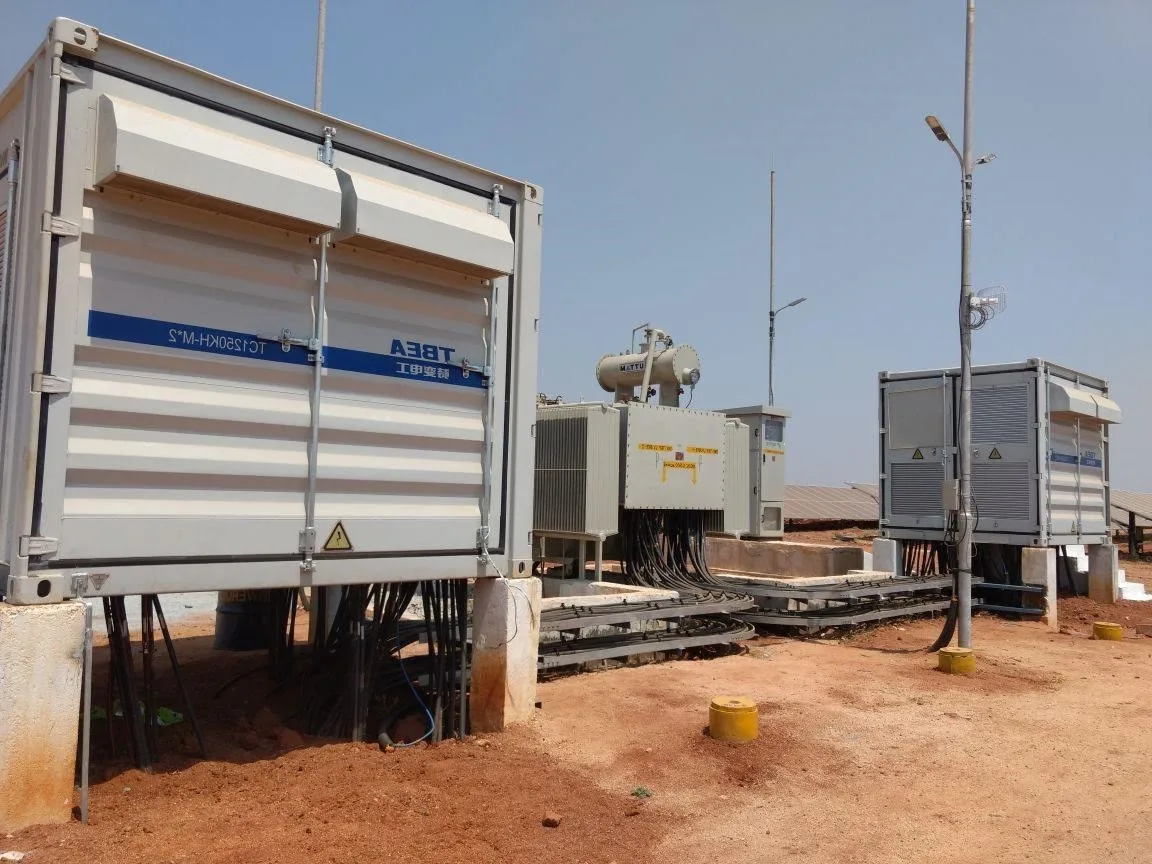
The container station below sits beside a transformer and a lighting pole. The pole carries a street lamp, a CCTV camera and communication equipment. These loads, along with the inverter control supplies, contribute to the plant's night-time grid import.
Weather monitoring stations also consume power, typically for sensors, data loggers and communication equipment. The two photos below show radiation sensors, wind sensors and a temperature sensor under a radiation shield, plus a box holding the logger and communication equipment.
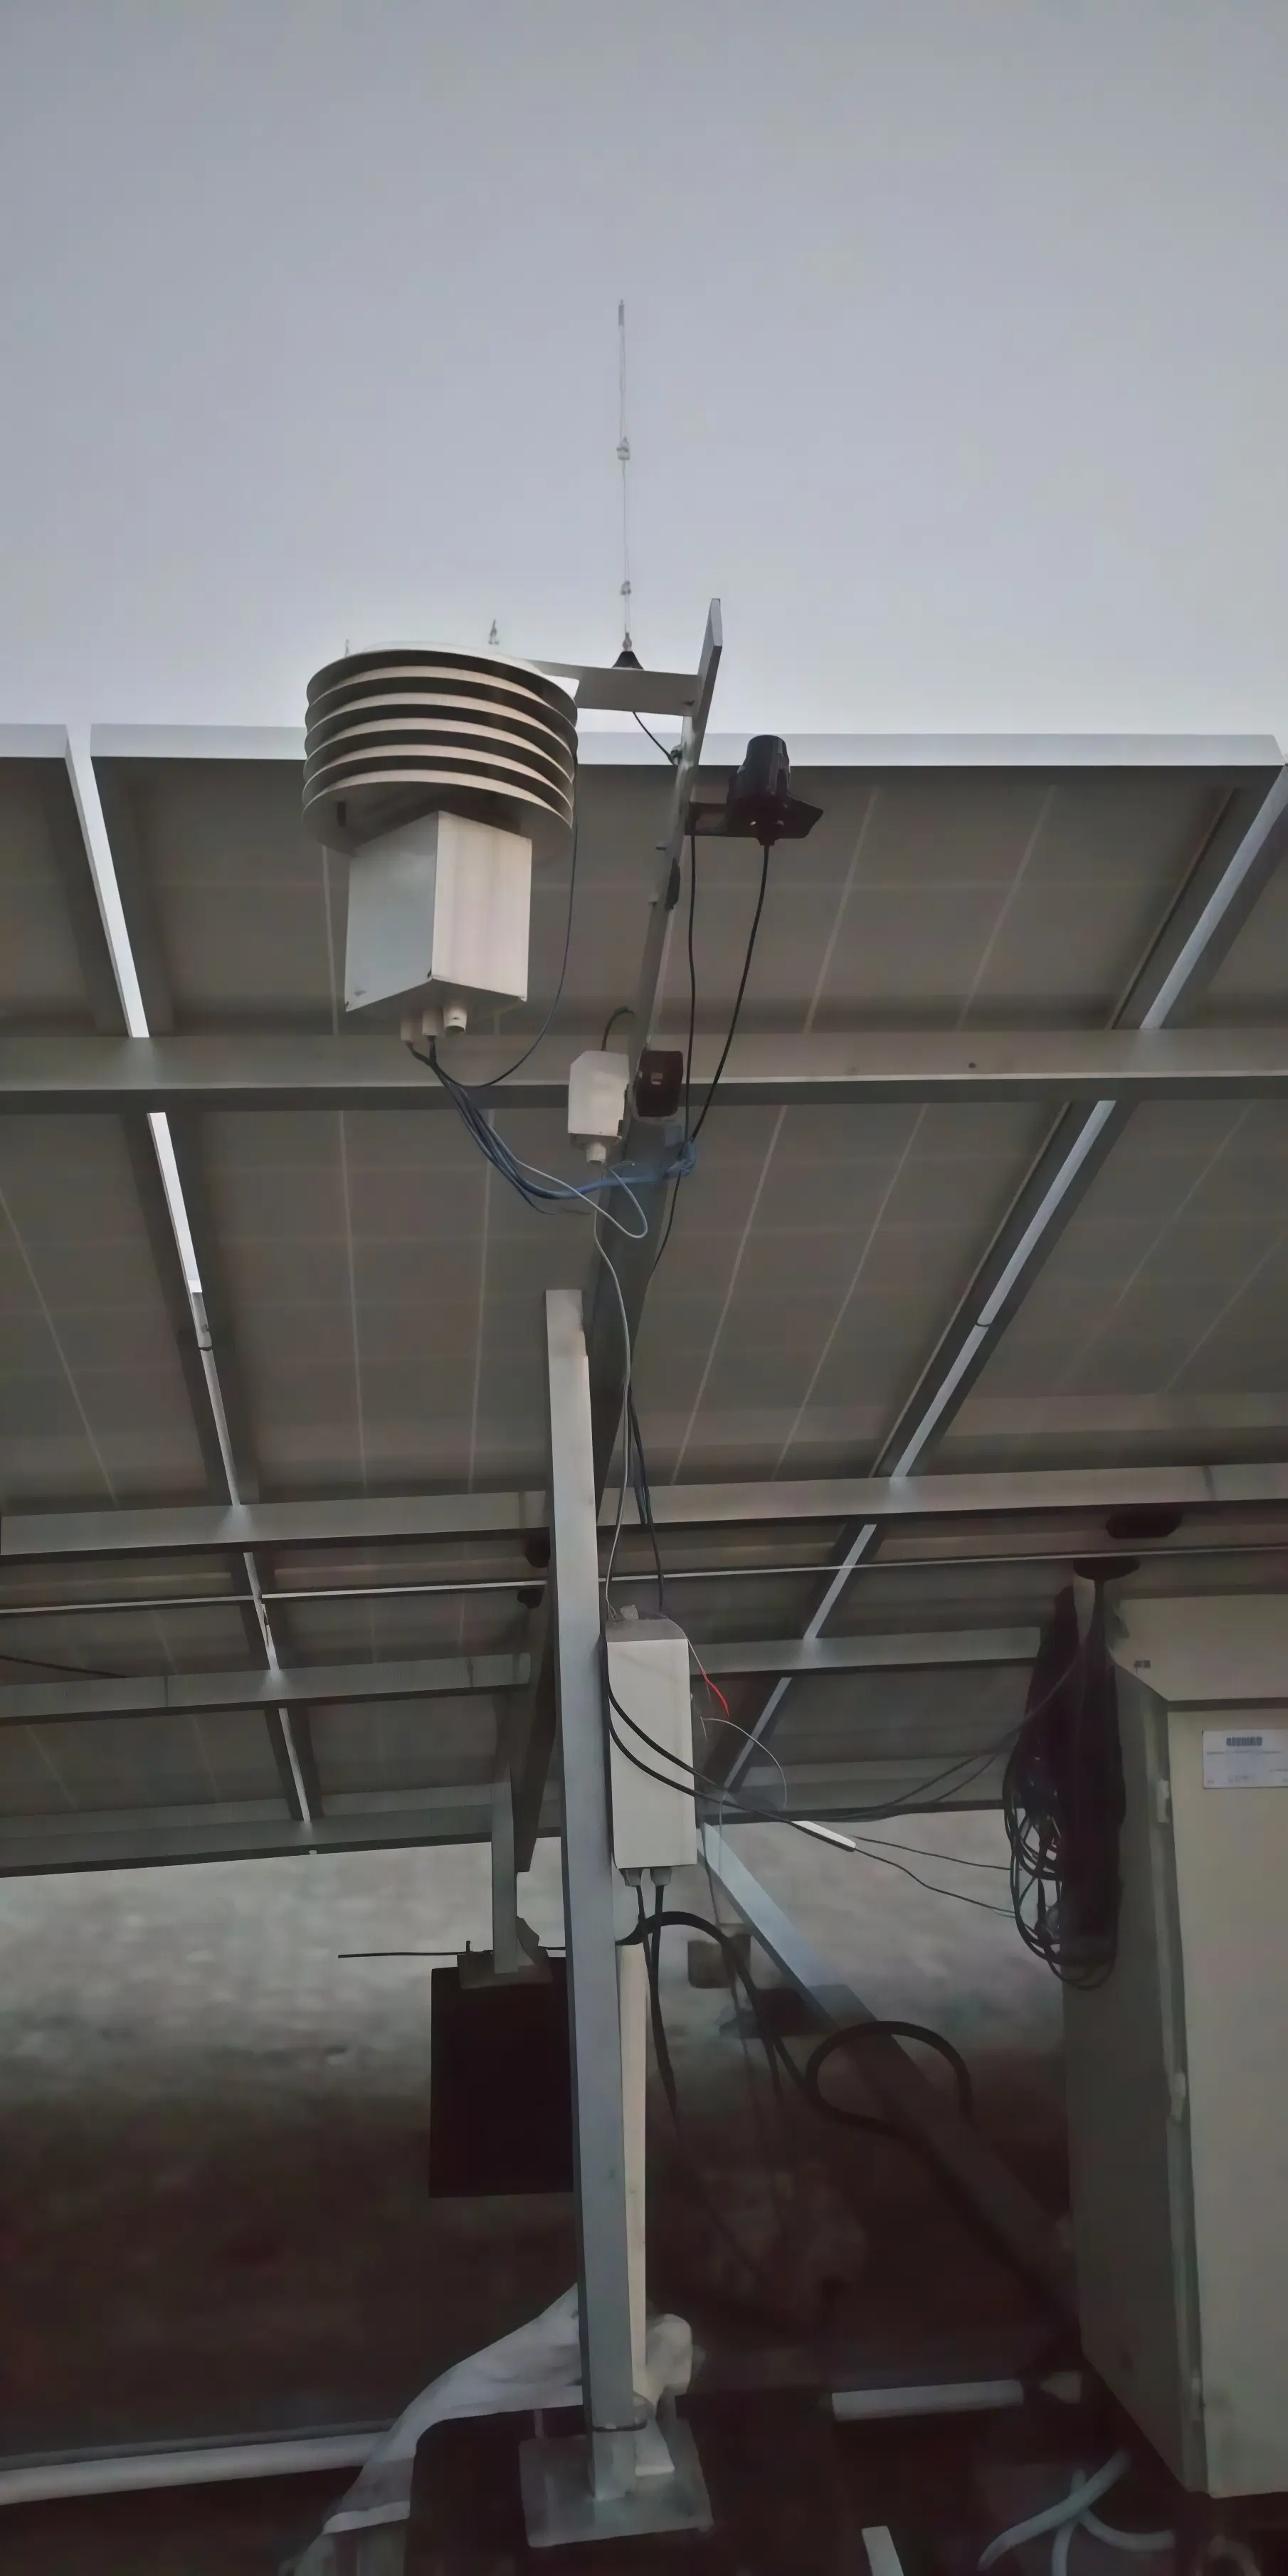
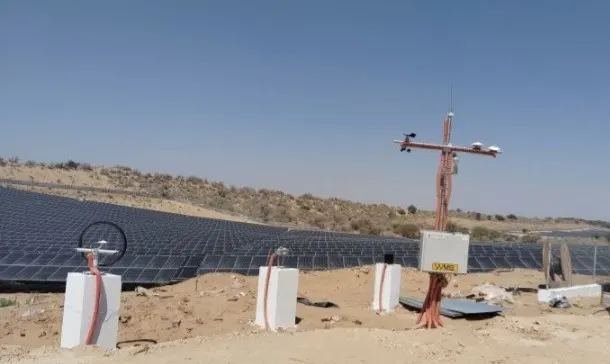
Check your plant's overnight load curve from midnight to dawn. A relatively stable load is expected, while sudden changes may indicate equipment switching on or off. If a change appears after maintenance, check whether any equipment was left running.
Three avoidable night loads at a 15 MWp plant
This plant has 15 MWp of DC capacity and 16 central inverters. Fourteen inverters are rated 1 MW and two are rated 630 kW. Night-time power consumption was higher than expected from the equipment list, and I found three avoidable loads:
- Fluorescent lamps stayed on at night, so I had them replaced with LED lamps.
- Cooling in some inverter rooms ran through the night without need, so I switched the cooling units off after sunset.
- Transformer cooling fans, installed for hot summers, kept running at night, so I switched them off at night.
Before changing any cooling schedule, check the manufacturer's operating limits, control logic and temperature settings. Switch off equipment only when it is confirmed unnecessary under the operating conditions. Do not disable required inverter or transformer cooling simply because the plant is not generating.
Where to meter auxiliary energy
Your APC figure depends on where the auxiliary loads are connected and what each meter records. Three arrangements exist in the field:
- Auxiliary loads supplied from the plant's AC bus. If the loads are connected on the plant side of the export meter, their daytime consumption reduces the energy recorded as export. At night, the grid supplies these loads if the plant imports power and the supply passes through the bidirectional meter.
- Separate auxiliary feeder with its own meter. The meter records the energy consumed by the loads connected downstream of it. Use interval data, if available, to separate daytime and nighttime consumption.
- Bidirectional meter at the grid interconnection, such as an ABT meter. The meter records imported and exported energy separately. Whether settlement nets these quantities against each other depends on the PPA and applicable settlement rules. Night import may include auxiliary consumption, transformer no-load losses if the transformer remains energized within the metering boundary, and other loads or losses within that boundary. The import register alone does not identify auxiliary consumption separately.
Confirm the arrangement against your single-line diagram and PPA clause before you report APC.
Avoid one shortcut. Do not treat summed inverter AC energy minus export energy as auxiliary consumption. The difference also includes transformer and cable losses, meter errors, and may exclude auxiliary loads supplied outside that metering boundary. Trend it as a reconciliation figure, and investigate sudden changes before attributing them to APC.
How APC changes net energy, PR and CUF
Define gross energy as the summed inverter AC output. Define auxiliary energy as the measured consumption of loads classified as auxiliary under your reporting methodology.
APC_aux (%) = E_aux ÷ E_gross × 100
For intervals in which the plant exports power, compare energy values over the same time intervals along the defined electrical path from the inverter AC terminals to the export meter:
E_export = E_gross,exp − E_aux,exp − E_tx,exp − E_cable,exp
Each term with the subscript exp covers those export intervals. E_gross,exp is the summed inverter AC output over them. E_aux,exp is auxiliary energy supplied from the plant side of the export meter during them. E_tx,exp and E_cable,exp are transformer and cable losses over the same intervals, and E_tx,exp includes transformer no-load loss while the plant exports. The meter position decides which losses sit on the path between the inverter and the export meter. Account separately for intervals when the plant imports power, including nighttime transformer losses and grid-supplied auxiliary loads, before you calculate E_net under the applicable settlement method.
Where the applicable settlement methodology defines net energy as exported energy minus imported energy:
E_net = E_export − E_import
The total net-to-gross deduction is different from auxiliary consumption alone:
Deduction (%) = (E_gross − E_net) ÷ E_gross × 100
For PR, use the same reference-energy denominator and reporting period. For CUF, use the same plant capacity basis and reporting period.
PR_net = PR_gross × E_net ÷ E_gross
CUF_net = CUF_gross × E_net ÷ E_gross
Example: if total deductions between gross and net energy equal 2% of gross energy, a gross PR of 80% becomes a net PR of 78.4%. This is an arithmetic illustration, not plant data.
Do not label the total net-to-gross deduction as APC unless your contract or reporting methodology explicitly defines APC to include those losses.
The Capacity Based PR calculator uses the AC energy value you enter. Use the measurement basis required by your reporting methodology. For CUF / PLF calculator, follow your PPA's definitions for energy and plant capacity. Mixing gross and net energy, or DC and AC capacity, can make reports for the same month disagree. See Which Performance Ratio Should You Use? and CUF vs PLF in Solar Plants.
APC percentage rises in a cloudy or monsoon month when total auxiliary energy stays roughly constant while gross generation falls. Track nighttime import in kWh/day separately from total APC percentage. A stable nighttime baseline shows the nighttime component has not increased. This does not prove total APC is unchanged, because daytime loads vary too.
Reading abnormal auxiliary data
| Symptom | First check |
|---|---|
| Night import rises after maintenance | Lighting, heaters, manual fan switches, and any breaker left closed by mistake. |
| Daytime auxiliary rises while generation stays flat | Check cooling demand, fan speed, clogged filters and room AC runtime. Compare similar inverters. |
| One inverter draws less auxiliary than its neighbours | Compare operating conditions, fan status, alarms and temperature trends. Low draw alone does not prove a fan failure. |
| APC percentage rises but night kWh per day stays flat | Check whether lower monthly generation explains the increase in APC percentage. |
| Gap between inverter energy and export energy widens | Check meter time alignment, CT/PT ratios, transformer losses and cable losses, before you blame auxiliary load |
Monthly reconciliation steps
- Record monthly export, import and auxiliary-feeder energy, where separately metered.
- Record summed inverter AC energy for the same reporting period.
- Select one clear night window and divide the night import by its hours to get an average import in kW.
- Calculate APC percentage and nighttime energy in kWh/day.
- Compare monthly kWh/day first, then APC percentage.
- Record whether gross or net energy was used for PR and CUF, so next month uses the same basis.
Frequently asked questions
What is auxiliary power consumption in a solar power plant?
Auxiliary power consumption is the energy used by a solar plant's supporting equipment, including control supplies, SCADA, weather stations, lighting, CCTV and auxiliary-fed cooling systems. Transformer losses are treated separately unless the applicable contract or reporting methodology includes them in APC.
Is auxiliary consumption deducted from solar plant generation?
Many PPAs settle on net energy at the interconnection point, after auxiliary consumption. The metering arrangement and the PPA clause decide whether daytime and night auxiliary energy both count. Read both documents before you report.
Why does a solar plant draw power at night?
Energized transformers, inverter control supplies, SCADA, weather stations and security lighting keep running after sunset. The grid import meter records their combined draw when they sit inside its metering boundary.
How do you calculate auxiliary power consumption percentage?
Divide auxiliary energy by gross energy for the same period and multiply by 100. Gross energy is the summed AC output of your inverters.
Does auxiliary power consumption affect Performance Ratio?
Yes. When PR uses net energy instead of gross inverter AC energy, the result can be lower because of auxiliary consumption and electrical losses within the relevant measurement boundary. Keep the reference-energy denominator consistent, and do not label all net-to-gross losses as APC unless the reporting methodology defines it that way.
How do you reduce auxiliary power consumption at a solar plant?
Start with night loads. Replace fluorescent lamps with LEDs, then review inverter room cooling and transformer fans. Check the manufacturer's limits and control settings before you change any cooling schedule, and switch off only equipment that temperature does not call for. Read the import register over the same night window before and after each change.