Hotspot Effect in Solar Panels: How It Reduces PR and How to Detect It
A single underperforming cell can drag an entire module — and over time, an entire string — into a loss spiral. That is what the hotspot effect does. For O&M engineers and asset managers, understanding how hotspots form, how they reduce Performance Ratio, and how to find them before they escalate is essential day-to-day knowledge.
What Is the Hotspot Effect in Solar Panels?
Solar cells within a module are connected in series. When all cells receive uniform sunlight and are in good condition, current flows evenly through the string. The moment one cell produces significantly less current than the others — because of shading, soiling, a crack, or a defect — that cell becomes a bottleneck.
The remaining healthy cells continue pushing current forward, but the weak cell cannot handle it. Instead of generating power, it starts absorbing power and dissipating it as heat. The affected zone on the module surface heats up sharply, creating what is known as a hotspot.
This is not a minor thermal variation. A severely hotspotted cell can reach temperatures typically between 80°C and 100°C — a level that damages the encapsulant, cracks the glass, melts solder joints, and accelerates the degradation of adjacent cells.
Key mechanism: When the operating current of a string approaches the short-circuit current of a weak cell, that weak cell enters reverse bias. All the power generated by the healthy cells gets dissipated in that one bad cell as heat. The higher the string current, the more severe the hotspot.
What Causes Hotspots in Ground-Mounted Solar Plants?
In utility-scale and commercial PV plants, the causes fall into two broad categories: external field conditions and module-level defects.
External Field Conditions
- Partial shading: Shadows from vegetation, structures, soiling mounds, or inter-row shading block individual cells. Even a single leaf or a streak of bird droppings is enough to trigger the reverse-bias mechanism.
- Dust and soiling: Dust accumulation is a persistent issue in many utility-scale plants, especially in dry climates with low rainfall. When dust builds up unevenly — often heavier at the lower edge of tilted modules — individual cells get shaded while the rest of the string operates normally.
- Temporary debris: Fallen leaves, plastic fragments, and bird nests deposited on modules create localised shading that can persist for days.
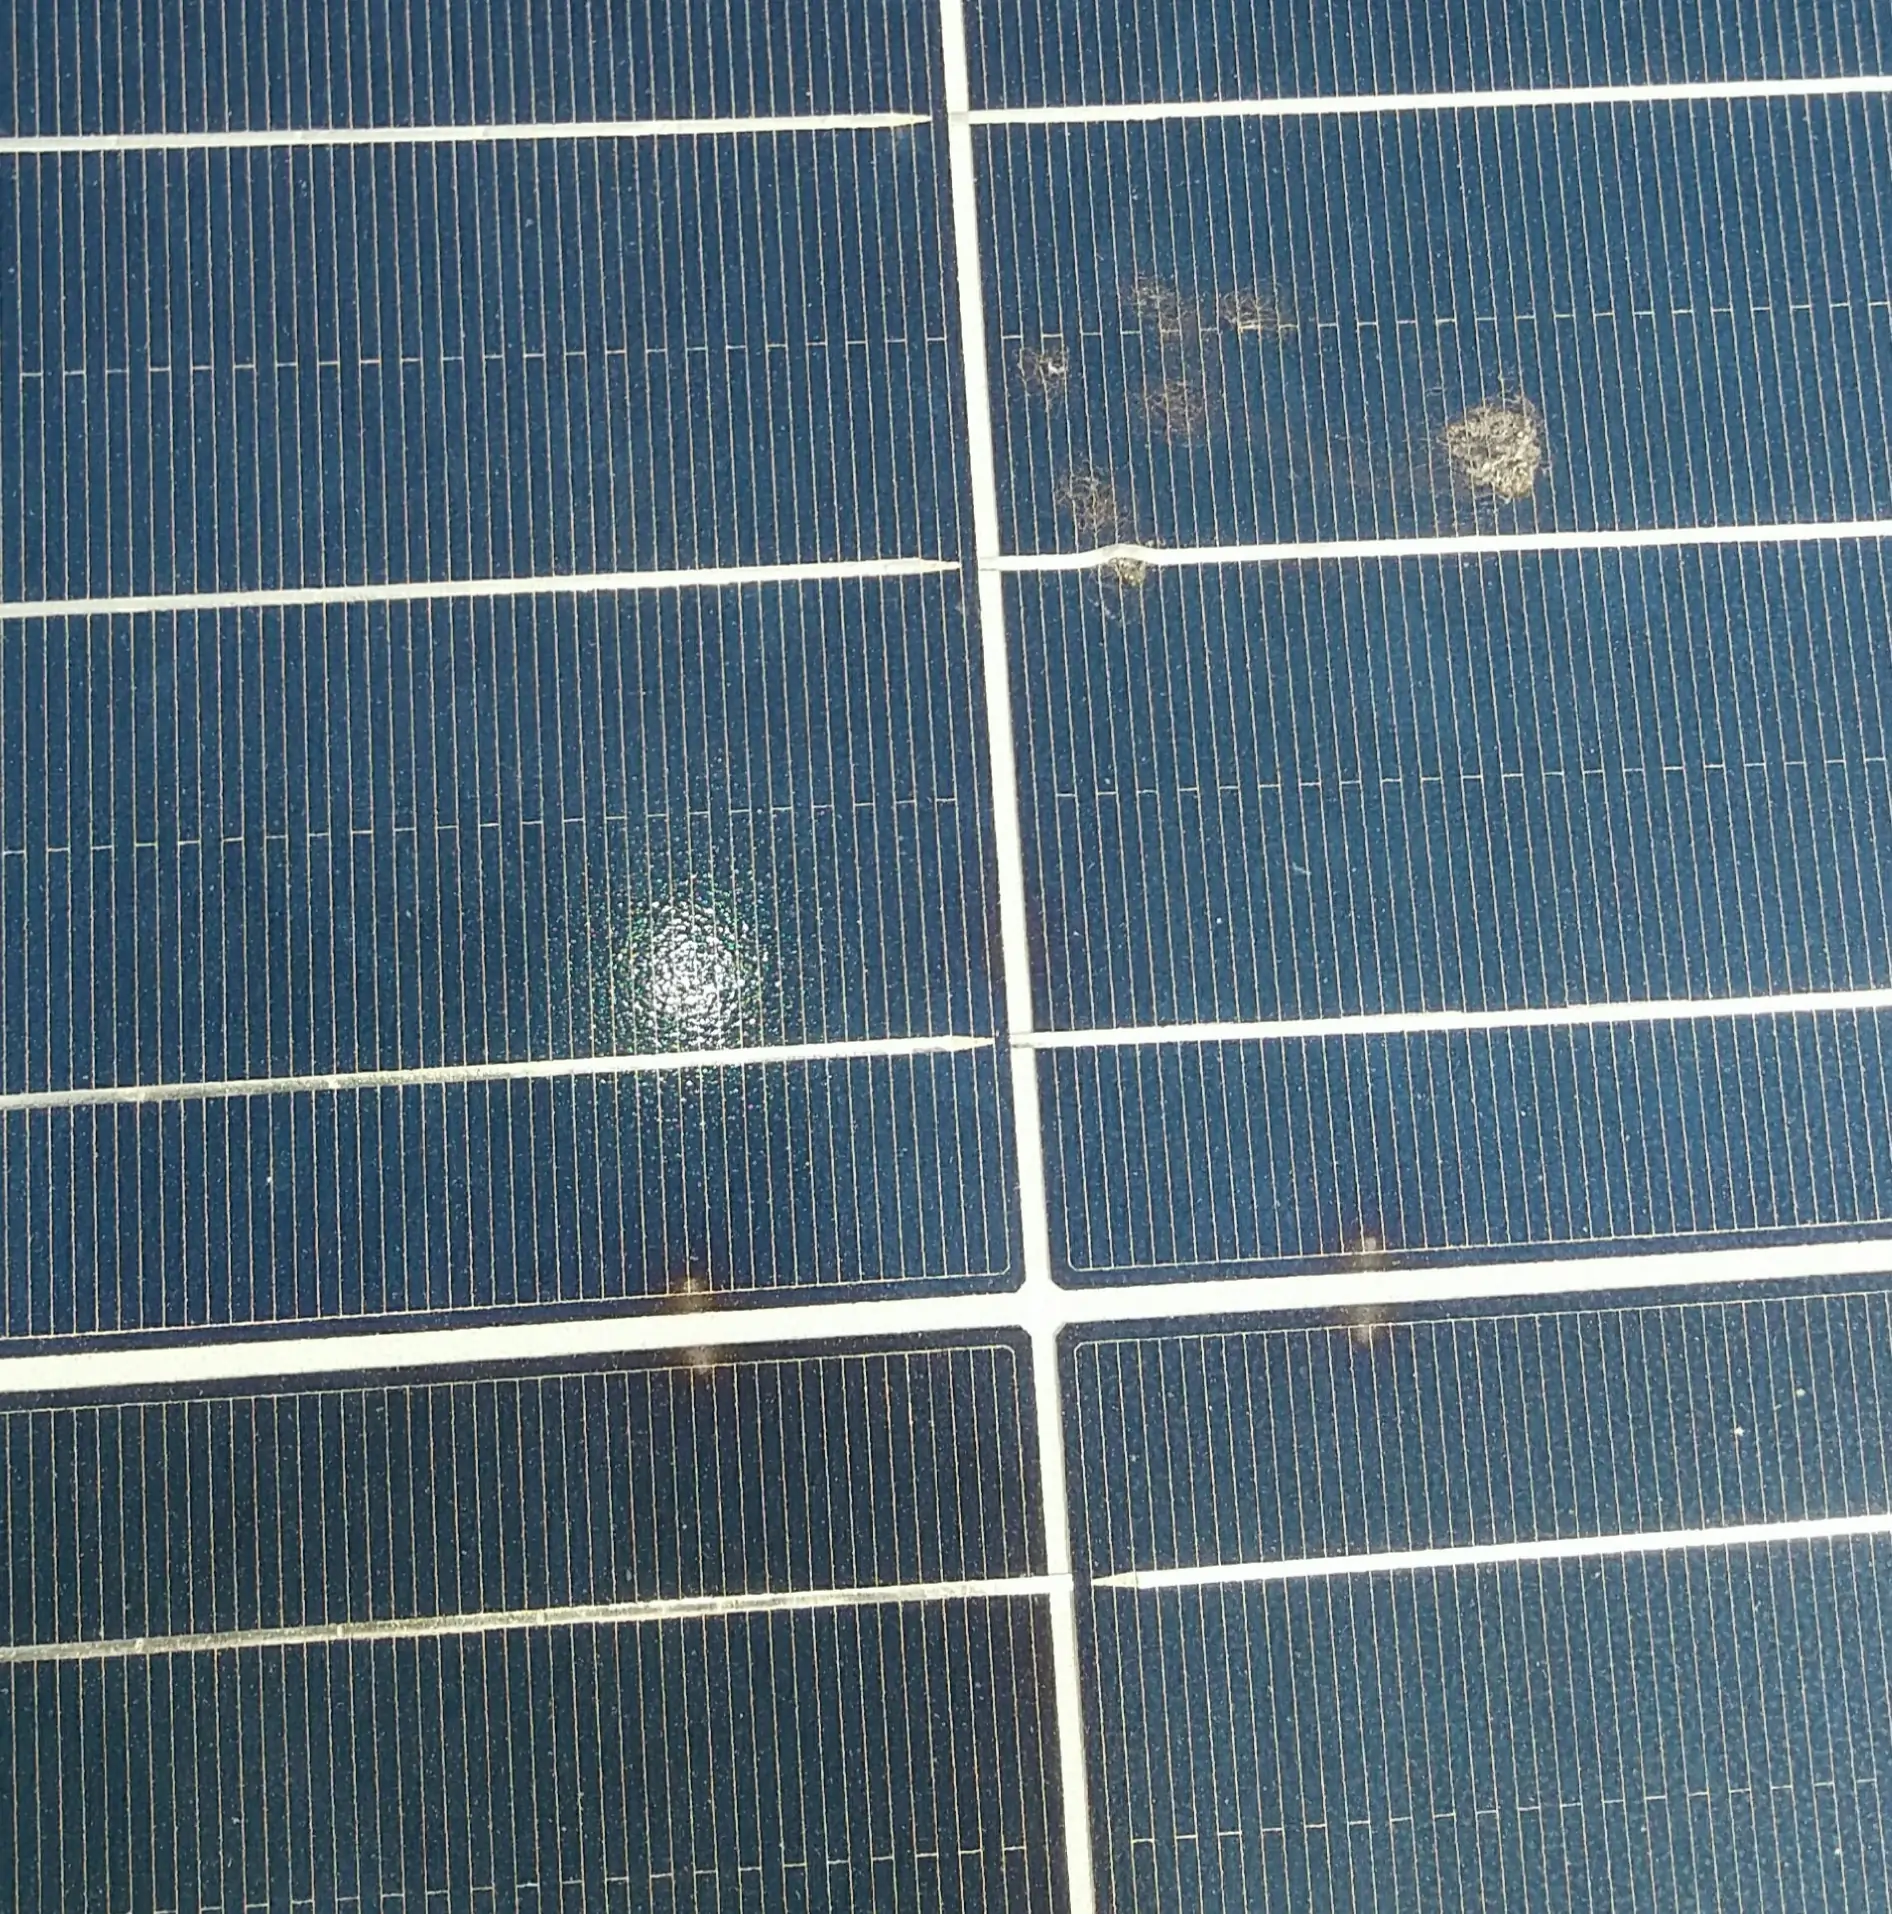
Bird dropping deposits and localised soiling on module cells — one of the most common hotspot triggers in utility-scale PV plants worldwide. Even small deposits shade individual cells and push them into reverse bias under string current
Module-Level Defects
- Cell cracks (microcracks): Physical impacts during transport, installation, or hailstorms create hairline fractures. These cracks reduce a cell's current-carrying capacity, making it susceptible to hotspot formation under load.
- Failed bypass diodes: Bypass diodes exist specifically to divert current around a shaded or weak substring. When a diode fails in open-circuit mode, it loses this protective function — and the substring beneath it is fully exposed to reverse bias heating.
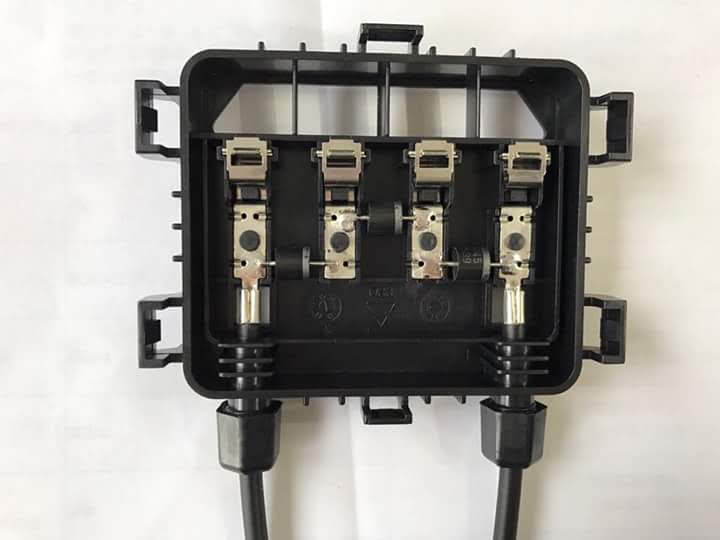
Inside a solar module junction box: three bypass diodes in their clips, one per cell substring. When any of these diodes fails in open-circuit mode, its substring loses protection — and every shading event becomes a potential hotspot event for that zone.
- Cell mismatch: Cells with slightly different electrical characteristics, especially in older or poorly sorted modules, can generate unequal currents, causing localised heating when connected in series.
- Potential Induced Degradation (PID): PID causes leakage currents that degrade individual cells over time, lowering their short-circuit current and making them hotspot-prone — particularly in high-humidity conditions and on negatively grounded string inverter systems.
How Hotspots Reduce the Performance Ratio of Your Plant
Performance Ratio (PR) measures how much of your plant's theoretical energy output is actually delivered to the grid — accounting for all real-world losses like temperature, soiling, and shading. Hotspots hit PR from multiple directions simultaneously.
Research on PID-affected modules found a mean PR of just 71.16% — well below the 83–88% range typical of healthy utility-scale plants.[3]
- Direct power loss: The shaded cell dissipates power as heat instead of delivering it to the grid. That lost energy directly reduces the plant's actual output, pulling PR down.
- Bypass diode activation: When a cell enters severe reverse bias, its bypass diode is designed to redirect current around the affected substring. However, research confirms that in standard array configurations, bypass diodes conduct effectively only near the short-circuit point — not at the maximum power point where systems normally operate. This means the hotspot can continue building heat even when a bypass diode is present.[2]
At the Pasir Mas Solar Farm in Malaysia, thermal imaging confirmed that dust-driven hotspots affected 19.91% of all PV strings, with the plant's overall PR ranging from 81% to 89% across the measurement period.[5] Multiply that across hundreds of modules with microcracks or uneven soiling, and annual energy yield losses in the range of 5–15% are realistic based on industry operating experience — a direct hit to revenue.
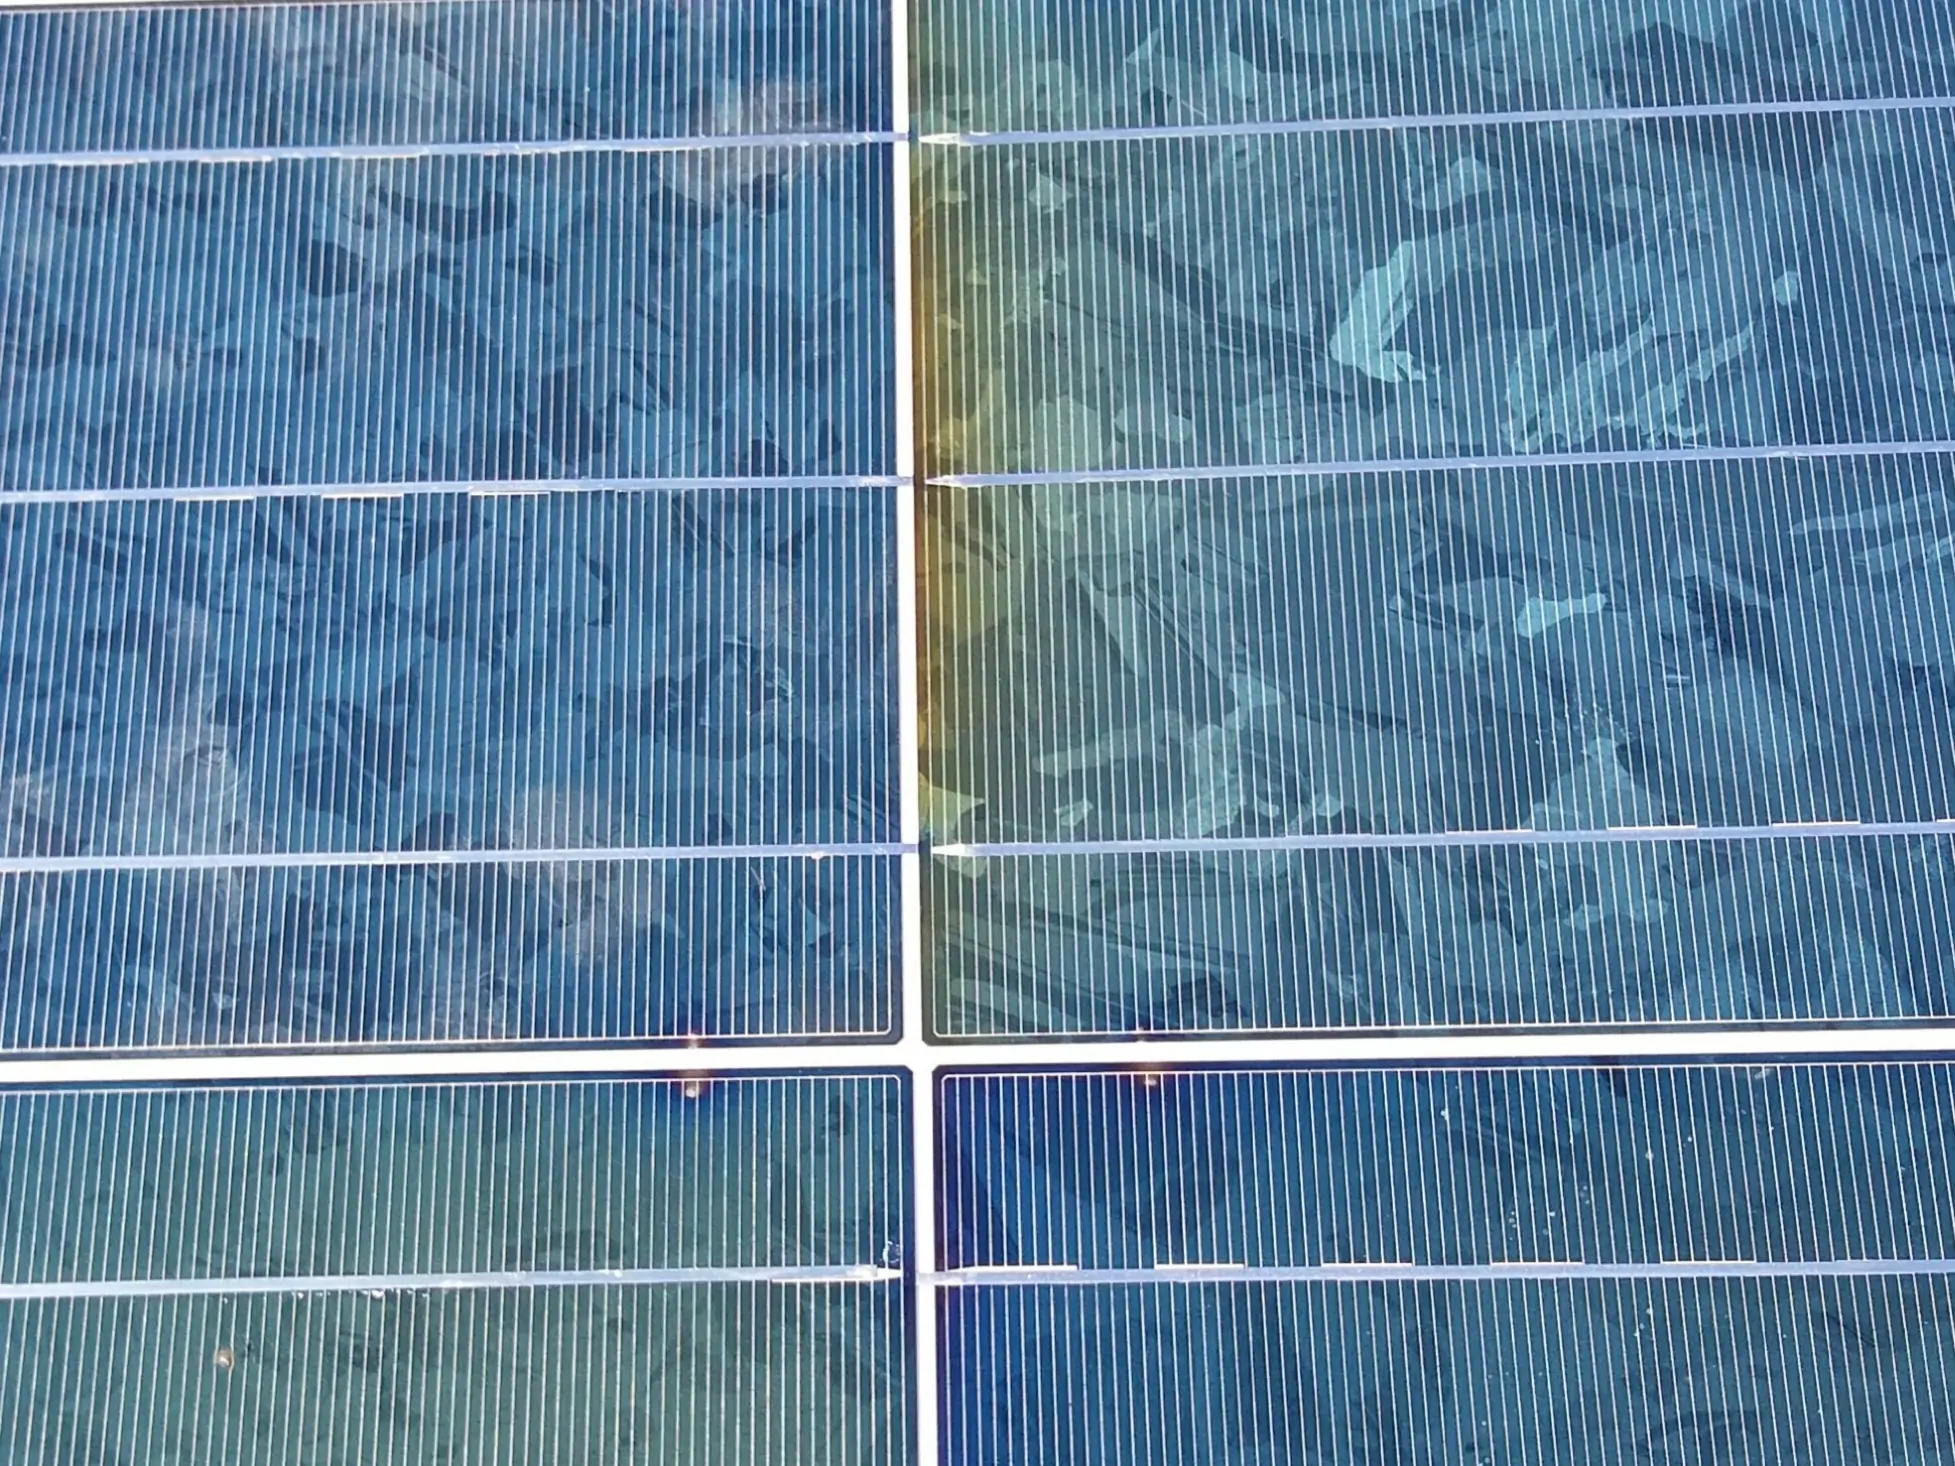
End-stage hotspot damage: encapsulant delamination, yellowing, and severe bubbling across multiple cells. At this point the module has suffered irreversible structural damage and requires replacement. Catching hotspots early through IR thermography prevents reaching this stage.
Why Bypass Diodes Alone Won't Save You
It is common to hear: "bypass diodes protect against hotspots." Partly true — but not for small-area shading. A falling leaf, bird dropping, or dust patch covers just 5–10% of a cell. In that scenario, conventional bypass diodes often do not conduct because the module voltage has not dropped enough to trigger them. The shaded cell stays in reverse bias, heating up while the bypass diode remains off.[2]
Research on standard Total-Cross-Tied (TCT) arrays confirms this behavior in controlled experimental studies: bypass diodes conduct effectively only near the short-circuit point, not at the maximum power point where systems operate. The consequence is that even a small shaded area can lead to premature module failures and zero power output from the shaded PV string — without the bypass diode ever activating to prevent it.[2]
MOSFET-based mitigation circuits have been shown to reduce hotspot cell temperature by up to 27.45% compared to conventional bypass diodes, but such retrofits remain uncommon in operational plants.[2] For now, the practical answer remains early detection through monitoring and thermal inspection.
Tracking your plant's Performance Ratio over time is the first step to catching hotspot-related losses before they compound. Use our Capacity Based PR Calculator to benchmark your plant against expected output.
Open PR Calculator →How O&M Engineers Detect Hotspots in the Field
Hotspots are almost always invisible to the naked eye at early stages. The cell surface discolouration or burn marks that appear in textbook images are signs of an advanced, long-neglected fault. In a well-managed plant, you want to catch them well before that point.
1. String-Level Monitoring — The First Alert
Your SCADA or monitoring system is where hotspot-related losses typically surface first — not as "hotspot detected," but as an unexplained generation shortfall on a specific string or inverter input. If one string consistently underperforms its neighbours under similar irradiance conditions, that string is a candidate for physical inspection.
String-level monitoring is your early warning layer. It narrows a potential fault down from hundreds of modules to a manageable subset before you deploy any inspection equipment on the ground.
Persistent generation loss on a string drives both CUF and PR downward. Our CUF calculator helps you quantify the real-world energy impact of underperforming strings at the plant level.
Open CUF Calculator →2. Infrared (IR) Thermography — The Definitive Diagnostic
Infrared thermography is the standard diagnostic method for hotspot detection in operational PV plants. It captures the thermal image of modules during normal operation — a hotspotted cell or substring shows up as a distinctly warmer zone compared to surrounding cells.
The international standard governing this inspection process is IEC TS 62446-3:2017, which defines the equipment, ambient conditions, inspection procedure, and reporting requirements for outdoor thermographic inspection of PV plants in operation. Compliance with this standard ensures that results are comparable, auditable, and defensible — whether for warranty claims, technical due diligence, or insurance purposes.[4]
Key conditions required by IEC TS 62446-3 for a valid outdoor thermographic inspection:
- Plane-of-array irradiance above 600 W/m² — higher irradiance means better thermal contrast between good and faulty cells
- Wind speed below 28 km/h to prevent convective cooling that can mask temperature differences
- Minimal cloud cover and no fresh soiling that could create false temperature variations
- Minimum image resolution of 5×5 pixels per cell when using drone-mounted cameras
Field note: A temperature difference (ΔT) of >20°C above adjacent reference cells is widely treated as a severe thermal anomaly requiring priority action. Lower ΔT values (5–10°C) still warrant logging and monitoring, especially if they recur across multiple modules in the same pattern.
3. Drone-Mounted IR Cameras — Practical at Scale
For plants above 1 MW, walking the array with a handheld thermal camera is time-consuming and often impractical during the narrow irradiance window that inspection conditions allow. Drone-mounted radiometric thermal cameras solve this problem.
A drone inspection of a 1 MWp plant can be completed in roughly 12–15 minutes of flight time, generating radiometric thermal data that classifies faults by type and severity. IEC TS 62446-3 covers drone-based inspection as a procedure for identifying problematic subareas, strings, and modules — and it is now standard practice in most technical due diligence scopes for utility-scale PV transactions.[6]
4. Electroluminescence (EL) Imaging — For Module-Level Diagnosis
When IR thermography flags a problem module, Electroluminescence imaging can confirm the root cause. EL imaging uses a camera sensitive to near-infrared light to capture light emitted by the module under electrical forward bias. Cracked cells, PID-affected areas, and defective cell interconnects show up as dark regions in the EL image.
EL is typically done at night or in darkness and requires the module to be temporarily disconnected from the string — so it is a targeted diagnostic step, not a plant-wide scanning tool. But when you need to decide whether a flagged module requires replacement or can stay in service, EL imaging provides the clearest answer.
5. I-V Curve Tracing — String-Level Electrical Fingerprint
I-V curve tracing measures the full current-voltage characteristic of a string or module under real operating conditions and compares it against the expected curve. Hotspots, bypass diode failures, and shading all produce characteristic deformations in the I-V curve — visible as inflection points or steps that a healthy string would not show.
This method complements thermal inspection by providing electrical evidence of the fault type, which is useful for warranty claims and root cause analysis when the thermographic signature alone is ambiguous.
Prevention: Getting Ahead of Hotspots
Detection is reactive. Prevention is cheaper. The following practices consistently reduce hotspot frequency in well-managed utility-scale plants.
- Regular cleaning cycles: In dry, high-soiling environments, cleaning frequency directly controls hotspot risk. Monthly or bi-monthly cleaning schedules prevent the uneven dust accumulation that triggers partial shading at the cell level.
- Scheduled thermographic inspections: Annual IR inspections — or semi-annual for plants in high-soiling or high-humidity regions — catch developing faults before they cause module failure. Many EPC contracts and O&M agreements now specify thermographic inspection frequency explicitly.
- Module procurement quality: Specifying EL testing during module acceptance at the factory catches microcracks and internal defects before installation. A module with a hidden crack on day one will typically develop into a hotspot within 6–12 months of field operation.
- Vegetation management: Overgrowth at module row edges creates shading on lower cell rows — the same cells that already experience the most inter-row shading at low sun angles. Keeping vegetation trimmed is one of the lowest-cost preventive actions available.
- PID mitigation: Where PID is a known risk (high system voltage, high humidity), grounding configuration adjustments or PID recovery boxes can significantly reduce cell-level degradation that would otherwise escalate into hotspot faults over time.
Frequently Asked Questions
What is the hotspot effect in solar panels?
The hotspot effect occurs when one or more cells in a solar module stop producing electricity — due to shading, soiling, or a defect — while the surrounding cells continue to push current through them. The weak cell then dissipates power as heat instead of generating it, creating a localised hot zone on the module surface.
How does a hotspot reduce the Performance Ratio (PR) of a solar plant?
Hotspots reduce PR by lowering the actual energy output of the affected modules. Research shows that PV modules with hotspot-causing defects operate at a mean PR of just 71.16%, far below the 83–88% range typical of healthy utility-scale plants. This gap between expected and actual output pulls the plant-level PR down directly.
How do O&M engineers detect hotspots in a solar plant?
O&M engineers detect hotspots using infrared (IR) thermography, as defined by IEC TS 62446-3:2017. Drone-mounted thermal cameras scan large plants efficiently. A temperature difference of more than 20°C above adjacent cells indicates a severe anomaly. String-level monitoring data showing unexplained generation loss is the first warning sign.
What causes hotspots in utility-scale solar plants?
The main causes are: partial shading from soiling, bird droppings, or vegetation; cell-level cracks from transport or hailstorm damage; bypass diode failure; cell mismatch within a module; and Potential Induced Degradation (PID). Dust accumulation is a particularly frequent trigger in dry, arid climates.
Can a hotspot be fixed, or does the module need replacement?
It depends on the root cause. If soiling or temporary shading is the trigger, cleaning or obstruction removal resolves it. If the cause is a cracked cell, failed bypass diode, or internal degradation, the module usually needs replacement. Hotspots caused by manufacturing defects often fall under warranty — making early detection and proper documentation important for claims.
Final Thoughts
The hotspot effect is one of the more insidious failure modes in solar PV — not because it is rare, but because it is quiet. It does not trigger an inverter fault. It does not appear on a single generation report as a clear anomaly. It slowly reduces PR, accelerates module degradation, and compounds over months into a meaningful financial loss.
For O&M engineers, the discipline of combining string-level monitoring with scheduled thermographic inspections and targeted EL diagnostics is what separates a well-managed plant from one that bleeds yield silently. Knowing where to look, what to look for, and what standard to apply when you find it is the practical foundation of effective solar asset management.
References
- Kumari, N., Singh, S.K., Kumar, S. & Jadoun, V.K. (2025). Analysis of single-cell shading impact on polycrystalline PERC module under hot-dry conditions. Energy Conversion and Management X. sciencedirect.com
- Baranwal, K., Prakash, P. & Yadav, V.K. (2024). Optimizing bypass diode performance with modified hotspot mitigation circuit. Solar Energy Materials & Solar Cells, 280, 113281. sciencedirect.com
- Dhimish, M. & Tyrrell, A.M. (2022). Power loss and hotspot analysis for photovoltaic modules affected by potential induced degradation. npj Materials Degradation, 6, 11. nature.com
- IEC TS 62446-3:2017. Photovoltaic (PV) systems — Requirements for testing, documentation and maintenance — Part 3: Outdoor infrared thermography. International Electrotechnical Commission. iec.ch
- Islam, M.I., Jadin, M.S. & Al Mansur, A. (2024). Characterization of accumulated unknown and soil dust on the PV system: An experimental study on the impact and performance analysis. Renewable Energy, 240, 122200. sciencedirect.com
- Gallardo-Saavedra, S. et al. (2025). Influence of irradiance and drone altitude in infrared thermography inspections of photovoltaic plants. EPJ Photovoltaics, 16, 12. epj-pv.org