Degradation & Insolation Corrected CUF in Solar PV
A simple and modern way to analyze real solar performance by removing the effects of aging panels and changing sunlight, so you can compare plants fairly across months, years and locations.
Have you ever compared a five-year-old solar power plant that had a cloudy year with a brand-new solar power plant in perfect sun?
Of course the older plant looks worse but that doesn’t mean it’s failing. Degradation & Insolation Corrected CUF fixes that. It removes panel aging and odd sunlight factors so you see the plant’s real performance.
What Is Degradation & Insolation Corrected CUF?
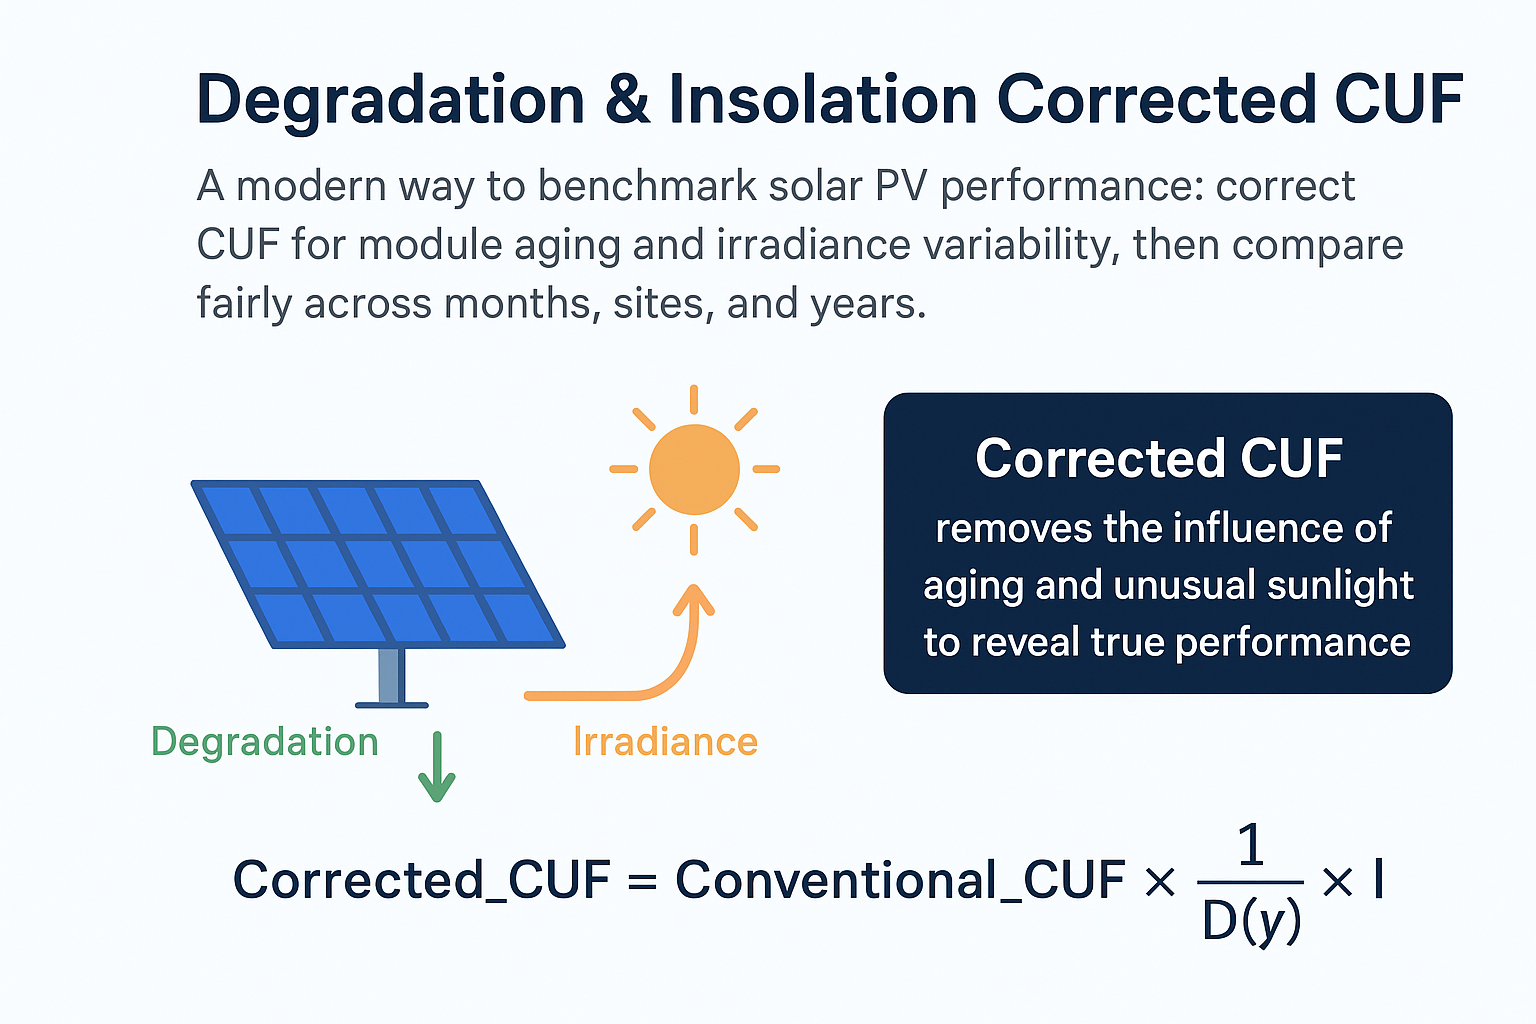
Conventional CUF is the ratio of actual energy generated to the theoretical maximum (rated capacity × hours) during a period. Corrected CUF scales this value to neutralize (1) module degradation and (2) deviation between actual and expected insolation. The result is a fair baseline for performance comparisons across time and locations.
Corrected CUF Formula (Practical Form)
Conventional_CUF = Energy_actual / (P_rated × Hours)

Degradation factor at age y: D(y) = (1 − d)y
  where d = annual degradation rate (e.g., 0.8% = 0.008)

Insolation correction factor: I = Expected_Insolation / Actual_Insolation

Corrected_CUF = Conventional_CUF × (1 / D(y)) × I
This practical formulation scales your observed CUF up to a “new-plant, expected-weather” baseline. Use consistently for internal benchmarking.
Corrected CUF Calculator – What It Does
When we look at a solar plant's Capacity Utilization Factor (CUF), the number is often goes up or down by two things that are not really under our control: PV module age and sunlight variability. The calculator removes both effects and shows the plant’s actual performance.
1. Removes the impact of module degradation
As modules get older, their output naturally drops. This natural decline makes older plants look under-performing even when they run fine. The calculator brings the CUF back to the level the plant would show if the modules were still new.
2. Normalizes for actual vs expected insolation
A cloudy month or weak-sunlight month can drop CUF even if the plant ran perfectly. The calculator corrects the CUF by comparing the sunlight you expected with the sunlight you actually received.
3. Helps evaluate performance trends correctly
By removing aging and irradiance variations, the trend you see actually reflects plant operation.
4. Simple inputs, practical output
Energy, capacity, hours, age, degradation rate, actual and expected insolation—that’s all the calculator needs to show both conventional and Degradation & Insolation corrected CUF.
Who should use Corrected CUF?
- O&M teams who need fair month-to-month comparisons should use it.
- Asset managers benchmarking sites across regions should use it.
- Auditors and technical analysts who want to separate weather and aging from controllable losses will find it useful.
Limitations and cautions
- Corrected CUF removes weather and age effects but does not remove curtailment or grid outages unless excluded explicitly.
- It depends on the quality of insolation data.
- Degradation assumptions matter: wrong assumptions will bias comparisons.
- Use contract values (e.g., PPA) for compliance, not corrected CUF.
Conventional CUF vs Corrected CUF
Both metrics matter. They answer different questions. Use the one that fits your goal.
| Point | Conventional CUF | Corrected CUF |
|---|---|---|
| What it shows | Raw output | Weather + aging removed |
| Good for | PPA compliance | O&M benchmarking |
| Low sun | Drops strongly | Adjusted baseline |
| Degradation | Reduces CUF | Neutralized |
| Users | EPCs, investors | O&M teams, auditors |
If you want true trend → Use Degradation & Insolation corrected CUF. For contracts → Use conventional CUF.
Worked Example — annual
These realistic values can be used in the calculator.
| Input | Value |
|---|---|
| Energy (year) | 1,680,000 kWh |
| Plant capacity | 1,000 kW |
| Hours | 8,760 h (365days) |
| Age | 4 years |
| Degradation (d) | 0.8% |
| Expected insolation | 2,000 kWh/m² |
| Actual insolation | 1,900 kWh/m² |
Step-by-step
- Conventional CUF = 19.18%
- D(4) ≈ 0.968
- I ≈ 1.0526
- Corrected CUF ≈ 20.86%
Corrected CUF ≈ 20.9%. Use this for fair benchmarking.
Typical Degradation Rates for Common PV Modules
Industry-average values compiled and regularly updated in 2024–2025.
| Module Technology | First-Year Degradation | Annual Degradation (after year 1) |
|---|---|---|
| Mono PERC | 2.0–3.0% | 0.55%/yr |
| TOPCon | 1.0–2.0% | 0.40%/yr |
| Heterojunction (HJT) | ≤1.0% | 0.30%/yr |
| Thin Film (CdTe/a-Si) | 0.8–1.0% | 0.80%/yr |
| Bifacial (various) | ~1.5% | 0.50%/yr |
Source: Compiled from NREL PV Fleet Performance Reports, Fraunhofer ISE Photovoltaics Report 2024, PVEL Scorecard, and latest manufacturer warranty sheets (Longi, Jinko, Trina, First Solar, REC, etc.). Values represent typical warranted or median observed rates as of 2025.
Always use module-specific warranted values for contractual purposes and measured field data for performance audits.
Common Mistakes When Calculating Corrected CUF
- Using GHI (Global Horizontal Irradiance) instead of POA (Plane of Array).
- Ignoring higher first-year degradation.
- Mixing different insolation datasets without conversion
- Using AC energy with DC capacity.
- Not excluding curtailment or grid outages before calculating CUF.
Fix these for accurate corrected CUF.
Best Practices for Using Corrected CUF
- Be consistent with periods : Compare month-to-month or year-to-year, not a mix.
- Track soiling & downtime : Degradation & Insolation Corrected CUF doesn’t excuse controllable losses—use it to flag them.
- Keep degradation realistic : Typical values often range ~0.5%–1%/year; use your module’s warranted rate if known.
- Use reliable insolation data : Site sensors (POA) preferred.
- Use same comparison period.
- Document degradation assumptions.
- Track soiling/downtime separately.
- Match AC/DC correctly.
Frequently Asked Questions
Is corrected CUF the same as PR?
No. PR isolates system losses; corrected CUF normalizes weather + aging.
What if I don’t know degradation?
Use the module’s warranted annual degradation or a conservative industry assumption, then stick with that assumption for consistency across comparisons.
Can I use monthly data?
Yes—ensure hours & insolation match the same month. Seasonal comparisons become much more meaningful with the corrected CUF.
Does the tool store inputs?
No. Everything runs locally in your browser.
Ready to compute? Open the Free Calculator.