Inverter Clipping in Solar Plants: Loss, CUF Impact, and PR Explained
Inverter clipping happens when the DC output from your solar array exceeds the inverter's rated AC capacity. Once the inverter reaches its maximum output limit, it cannot convert any additional DC power — and that unconverted energy is lost generation.
If your Performance Ratio drops during high-irradiance hours — or your monthly CUF is consistently below target — then inverter clipping is one of the first things to check.
What Is Inverter Clipping in Solar Plants?
Every inverter has a maximum AC output rating — say, 1000 kW for a 1 MW inverter. The connected DC array is usually sized larger than this, often by a factor of 1.1 to 1.3. This design choice is called DC oversizing, and it's intentional. It ensures the inverter runs near full load during morning and evening hours when irradiance is low.
The problem arrives most severely on cool, clear days — not necessarily the hottest ones. When irradiance is high and ambient temperature is low, module voltage stays elevated, pushing DC output well above what the inverter can process. This is why clipping is often worst in winter or early spring mornings, not in peak summer when high module temperatures reduce DC output and ease saturation. Between 11 AM and 2 PM on a clear winter day, the DC array can consistently outrun the inverter's rated AC capacity. The excess DC power simply goes unconverted. That lost energy is the inverter clipping loss — AC power saturation at the inverter stage.
Think of your inverter as a pipe with a fixed diameter. When DC flow exceeds the pipe's capacity, the overflow goes nowhere. It doesn't get stored, it doesn't get redirected — it is just lost generation.
Clipping is not a fault. It is a deliberate design choice built into the plant at the design stage. The real question for O&M teams is: how much is happening, and is it within acceptable limits?
Why Does Clipping Happen? The DC/AC Ratio Explained
The ratio between the DC array capacity and the inverter's AC rating is called the DC/AC ratio — or the Inverter Loading Ratio (ILR). A DC/AC ratio of 1.25 means a 1250 kWp array connected to a 1000 kW inverter.
Designers oversize DC arrays for a clear economic reason: inverters are more expensive per kW than additional PV modules, especially post-2022. Oversizing the DC array relative to the inverter means lower capital cost, more shoulder-hour generation, and a faster payback — as long as clipping stays controlled.
| DC/AC Ratio | Typical Annual Clipping Loss | Common Use Case |
|---|---|---|
| 1.0 – 1.1 | < 0.5% | Conservative design, high-cloud regions |
| 1.1 – 1.25 | 0.5% – 2% | Standard utility-scale (most common range globally) |
| 1.25 – 1.35 | 2% – 5% | High-insolation sites (e.g., desert climates like Rajasthan, India, or the Southwest US) |
| > 1.4 | 5% – 10%+ | Aggressive oversizing; needs detailed yield modelling |
Reference: Industry benchmarks aligned with NREL inverter clipping research and PVsyst default design recommendations.
Studies show that on sites where soiling is the dominant loss factor, optimal ILR can reach 1.35–1.40 — balancing clipping loss against soiling management costs. In contrast, a plant with automated cleaning would have a lower optimal ILR, since reduced soiling shifts the economics back toward less clipping. Context matters. [Measure soiling at your plant with our free Soiling Loss Calculator.]
Is Inverter Clipping Good or Bad?
This is one of the most searched questions around the topic — and the honest answer is: it depends on how much of it you have.
A controlled amount of clipping is an intentional, economically sound design choice. Beyond a certain threshold, it becomes a real problem. Here's where the line sits in practice:
When clipping is acceptable:
- Your DC/AC ratio is in the 1.1–1.25 range and clipping accounts for less than 3% of annual yield.
- The capital savings from the smaller inverter clearly outweigh the generation left unconverted at peak.
- The design was modelled, clipping was factored into the P50 estimate, and lenders were informed upfront.
- Shoulder-hour gains (morning and evening production) more than compensate for midday saturation losses.
When clipping becomes a problem:
- It was never modelled at the design stage — so the P50 estimate assumes energy that was never actually deliverable.
- Annual saturation loss exceeds roughly 5%, which in most project economics means it is no longer justified by the inverter cost saving.
- It is masking real faults — soiling, degradation, or string issues — making your O&M data unreliable.
- It shows up as unexplained PR deviation in lender reports, creating unnecessary disputes with off-takers.
The short version: clipping is not inherently bad. Unmodelled, untracked, and misunderstood clipping is.
How Inverter Clipping Directly Reduces CUF
CUF — Capacity Utilization Factor — measures how much energy your plant actually generates versus what it could theoretically generate if it ran at rated capacity for all 8760 hours of the year.
Clipping directly reduces what reaches your generation meter. Since CUF uses actual metered generation in its numerator, AC power saturation at the inverter pulls the number down directly and silently.
Illustrative example: Consider a 5 MWp plant in Rajasthan with a DC/AC ratio of 1.3. On clear summer days between April and June, the inverter reaches its maximum AC output during peak hours. If the DC power exceeds the inverter's rated AC capacity by an average of 300 kW for 2–2.5 hours per day, the daily energy loss from that block runs roughly 600–750 kWh. Over a 90-day high-irradiance season, that accumulates into a meaningful CUF shortfall. The actual numbers will vary by specific site irradiance, inverter model, and module temperature — this is meant to illustrate the order of magnitude, not a fixed benchmark.
SCADA systems typically report inverter output at the AC side. They show you the capped power — not what the DC array actually generated. Unless you specifically calculate unclipped energy using DC input data, clipping loss will never appear as a separate line in your O&M report.
The PR Problem — How Clipping Distorts Performance Ratio
Performance Ratio is designed to be a location-independent quality indicator. It tells you what fraction of the irradiance-available energy your plant actually delivered to the grid, after accounting for all system losses.
When clipping occurs, the irradiance that hits your modules is still being measured by the plant's weather station. But the energy output is capped below what that irradiance should theoretically yield. The PR formula sees full irradiance in the denominator and reduced actual generation in the numerator. Result: PR drops.
This effect is most visible in high-irradiance months. You may notice your plant's PR is higher during lower-irradiance seasons and lower during peak-irradiance seasons — even though the modules are performing identically. Some of that seasonal PR swing is clipping, not module or inverter degradation.
The Masking Effect — A Serious O&M Risk
There is a subtler problem that experienced O&M engineers need to understand: clipping can mask other real losses.
Research published in Renewable Energy (2024) showed that when an inverter is consistently saturating, moderate soiling losses become invisible in the monitored data. The inverter is already limiting output — so an additional 2–3% soiling loss does not change the AC output curve visibly. It just reduces the DC headroom being clipped. The net AC generation looks the same.
What this means practically: a plant with significant clipping can appear to have a stable PR while soiling losses, string-level degradation, or bypass diode faults quietly accumulate. Your cleaning intervals, your degradation tracking, and your fault response all become less reliable when clipping masks the baseline.
Reference: Micheli et al., Quantifying the impact of inverter clipping on photovoltaic performance and soiling losses, Renewable Energy, 2024.
Clipping Loss vs Grid Curtailment — Know the Difference
O&M teams often confuse these two. Both cause your plant to generate less than its potential. But their root causes and solutions are completely different.
| Parameter | Inverter Clipping Loss | Grid Curtailment |
|---|---|---|
| Cause | DC array oversized vs inverter AC rating | Grid operator or utility restricts export |
| Location | Internal — at the inverter | External — at the metering/grid interface |
| Predictability | High — modellable from DC/AC ratio and irradiance | Variable — depends on grid load and grid operator decisions |
| Appears in PR | Yes — reduces measured PR | Yes — reduces measured PR |
| SCADA visibility | Rarely flagged explicitly | Often logged as grid unavailability event |
| Remedy | Right-sizing inverter; design-stage correction | Grid operator coordination; BESS integration |
Both show up as generation loss in your monthly reports. Separating them requires comparing DC input data (at the inverter terminals) against AC output data (at the inverter's AC output). If DC power was available but AC output was capped at nameplate — that is clipping. If DC power itself was low or absent — that is curtailment or a grid trip event.
How to Detect Inverter Clipping in Your Plant Data
You do not need a separate analytics tool to spot clipping. Your existing SCADA data is enough, if you know what to look for.
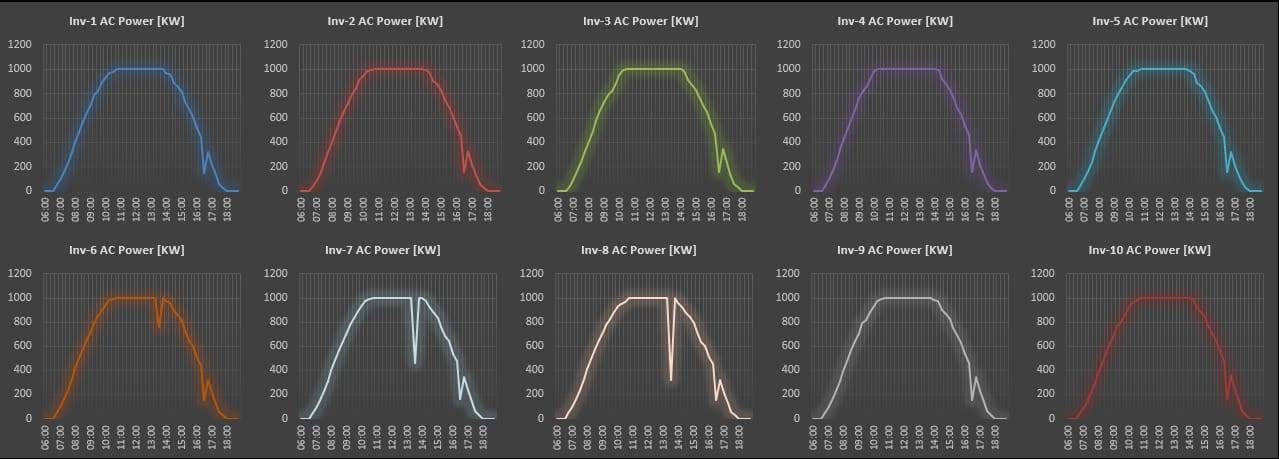
Step 1 — Check the AC Power Curve Shape
Pull the inverter's AC power output for a clear, high-irradiance day. A healthy, un-clipped plant produces a smooth bell curve peaking around solar noon. A clipping inverter will show a curve with a flat top — the output plateaus at the inverter's rated capacity and stays there for an hour or more before dropping off.
Step 2 — Compare POA Irradiance vs AC Output
Use 5-minute or 15-minute interval data. Plot POA irradiance against the inverter's AC power output. (Need POA data? Estimate plane-of-array irradiance from your plant's energy data using our free solar insolation calculator.) During clipping, irradiance stays high while AC output remains flat — that's your clipping window.
Step 3 — Calculate PR During Clipping vs Non-Clipping Hours
A practical field method: calculate average PR for hours when the inverter is running below 99% of rated capacity (non-clipping period) and compare it against PR during hours when the inverter is at or above 99% of rated capacity (clipping period). The difference gives you a PR delta that you can use to back-calculate unclipped energy loss. (Calculate performance ratio from your plant's DC capacity and POA data using our Capacity-based PR calculator. Monitor real-time performance ratio using live irradiance and power data with our Instantaneous PR Calculator.)
Method reference: SaurEnergy — Estimating Subhourly Clipping Losses from PR Trends
A true clipping plateau is flat. If your inverter's AC output fluctuates up and down near its rated capacity during clear-sky conditions — instead of holding steadily at nameplate — you are likely looking at an overheating inverter throttling its output, or a grid voltage issue causing the inverter to back off. Neither is clipping. Misidentifying these as clipping will give you a false loss figure and send your troubleshooting in the wrong direction.
How to Calculate Clipping Loss in a Solar Plant
You don't need dedicated software to estimate how much energy your plant is losing to DC-to-AC limitation. The core logic is straightforward.
The Basic Formula
Clipping loss, in simple terms, is the difference between what the DC array could have generated and what the inverter actually delivered during saturation periods:
The challenge is estimating "unclipped DC energy." Since your inverter caps output before you can measure the full DC potential, you work backwards using Performance Ratio.
The PR-Based Back-Calculation Method
This is the practical approach used at the plant level. It works with standard SCADA interval data:
Step 1. Identify your non-clipping PR baseline — the average PR when the inverter is running below 99% of its rated AC capacity. This represents your plant's true efficiency without saturation interference.
Step 2. Record actual AC output during hours when the inverter is at or above 99% of rated capacity (saturation hours).
Step 3. Calculate what the AC output should have been during those saturation hours using your baseline PR and the irradiance data from the same period.
Step 4. The difference between the expected AC output (using baseline PR) and the capped actual output is your estimated clipping loss for that period.
This method gives a reliable estimate using standard SCADA data. Use 5-minute or 15-minute SCADA data for better accuracy — hourly averages tend to underestimate clipping during short saturation spikes.
Reference: Estimating Subhourly Clipping Losses from PR Trends — SaurEnergy
What Is an Acceptable Level of Clipping?
There is no universal regulatory limit on clipping losses. Most regulatory frameworks focus on overall plant performance metrics like CUF (Capacity Utilization Factor) and PLF (Plant Load Factor), not internal loss breakdowns. So the threshold is primarily an economic question, not a compliance one.
In many utility-scale projects, design teams treat 0–3% annual energy loss from AC power saturation as financially justified — it typically reflects a DC/AC ratio in the 1.1–1.25 range where the capital savings from a smaller inverter outweigh the generation left on the table. That said, the right number depends on your site's irradiance profile, the tariff structure, and how aggressively the array was oversized. A plant in a high-insolation region with a flat-rate PPA will tolerate more clipping than one on a time-of-day tariff where peak-hour generation is priced higher.
Beyond roughly 5% annual clipping loss, it usually costs more than it saves and should be reviewed. For existing plants where resizing isn't feasible, the goal shifts: document it accurately, keep it out of your unexplained loss bucket, and use it to contextualise PR trends for lenders and off-takers.
Key Takeaways
- Inverter clipping occurs when DC array output exceeds inverter AC capacity — the excess energy is lost, not stored.
- Clipping directly reduces metered generation, pulling annual CUF downward — even if every other component performs correctly.
- It creates a measurable gap in PR, especially during high-irradiance months, and can be mistaken for module or plant degradation.
- Critically, clipping can mask real losses like soiling and string faults — making your O&M data less reliable.
- In many utility-scale projects, 0–3% annual energy loss from saturation is treated as acceptable — but the right threshold depends on your site's irradiance, tariff structure, and ILR. Beyond ~5%, a formal yield review is warranted.
- You can detect clipping using your existing SCADA data by identifying the flat-top plateau in inverter AC power curves during peak irradiance hours.
Frequently Asked Questions
References & Sources
- Micheli, L. et al. (2024). Quantifying the impact of inverter clipping on photovoltaic performance and soiling losses. Renewable Energy, Vol. 225.
- Avasthi, A., Garg, R. & Mahajan, P. (2026). Enhanced energy yield in floating solar power plants through optimal inverter loading ratios. Electrical Engineering, 108, 62. Springer
- SaurEnergy. (2023). Estimating Subhourly Clipping Losses of Inverter and Plant from Performance Ratio Trends. SaurEnergy
- NREL / Sandia National Laboratories. (2024). Quantifying the Impact of Inverter Clipping on Photovoltaic Performance and Soiling Losses. NREL Technical Report. NREL
- ScienceDirect — Impact of inverter DC to AC ratio on soiling losses. (2025).
- Aurora Solar Help Center. What is Inverter Clipping? Aurora Solar